Recent Updates Page 16 Toggle Comment Threads | Keyboard Shortcuts

  • Unknown's avatar

    Wang 21:53 on 2019-07-25 Permalink | Reply
    Tags: ,   

    Configure prompt in your Spinnaker pipeline 

    When you deploy your application, there might be some steps need your confirmation to ensure this stage is ok to proceed, Spinnaker provide “Judgment Configuration” mechanism to implement this.

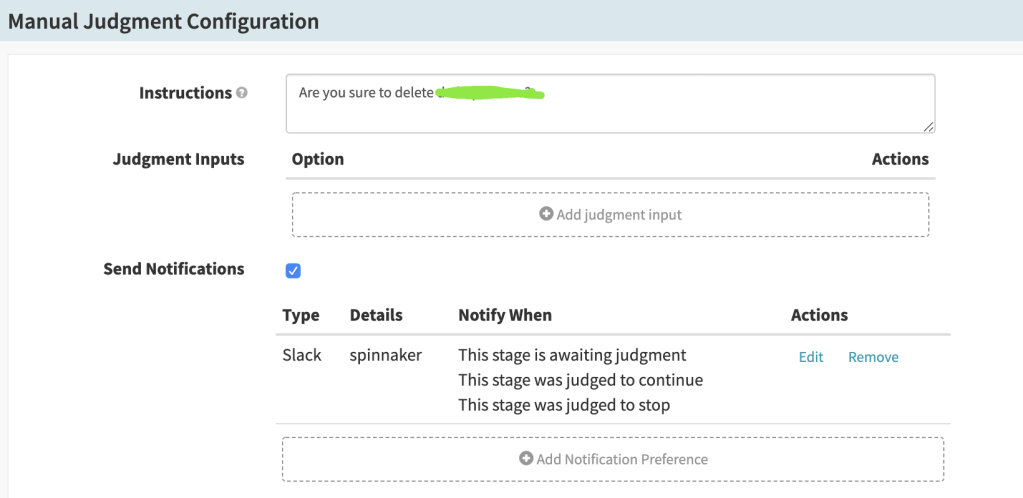
    When you add stage in your pipeline, you can select this functionality:

    Below is my configuration:

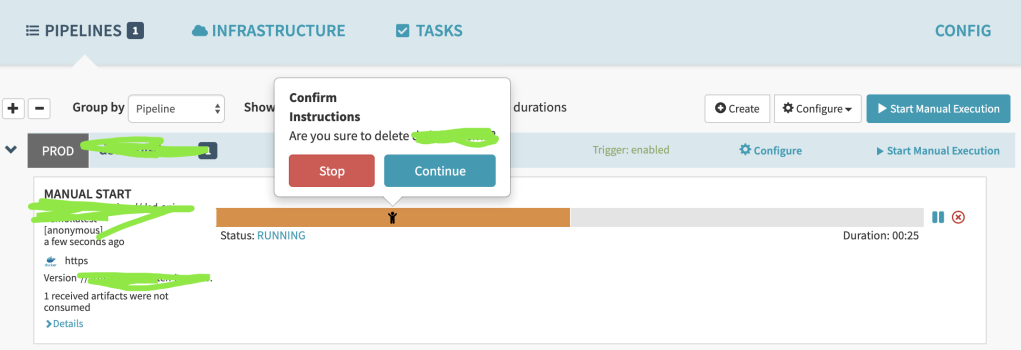
    Then when you deploy your application you will see the prompt, and you can decide whether proceed or not.

     
  • Unknown's avatar

    Wang 21:08 on 2019-07-19 Permalink | Reply
    Tags: ,   

    Separate CD process from Jenkins to Spinnaker 

    Spinnaker is an open-source CD tool which is developed by Netflix, now it’s integrated by cloud providers like AWS/GCP/Azure, you can customize your CD process freely, spinnaker doesn’t want to replace Jenkins, they’re focus on different domains.

    It’s a little complex to build Spinnaker, I deployed it by helm in our in-house k8s cluster, and did some modifications on the official chart.

    Then I deployed Spinnaker just like:

    helm repo update
    helm dependency update
    helm install --namespace=<NAMESPACE> --name <DEPLOY_NAME> <CHART DIRECTORY>
    

    Wait for a while you can see all the spinnaker related pods are running:

    Then you can expose Spinnaker deck service:

    export DECK_POD=$(kubectl get pods --namespace delivery-spinnaker -l "cluster=spin-deck" -o jsonpath="{.items[0].metadata.name}")
    kubectl port-forward --namespace delivery-spinnaker $DECK_POD 30900
    

    Now you can visit Spinnaker through browser by http://IP:30900

    Here is a example how I deploy my application through Spinnaker

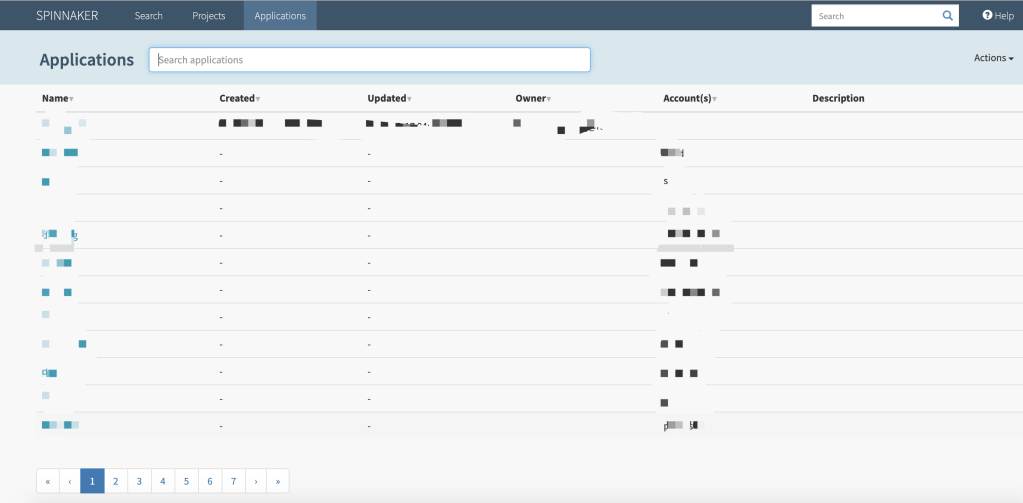
    1.Create Application & Project

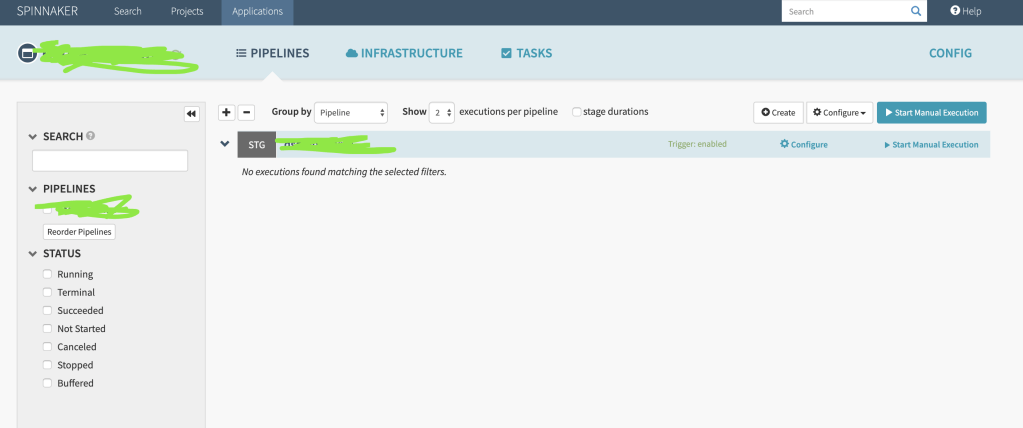
    2.Configure Pipeline under the application

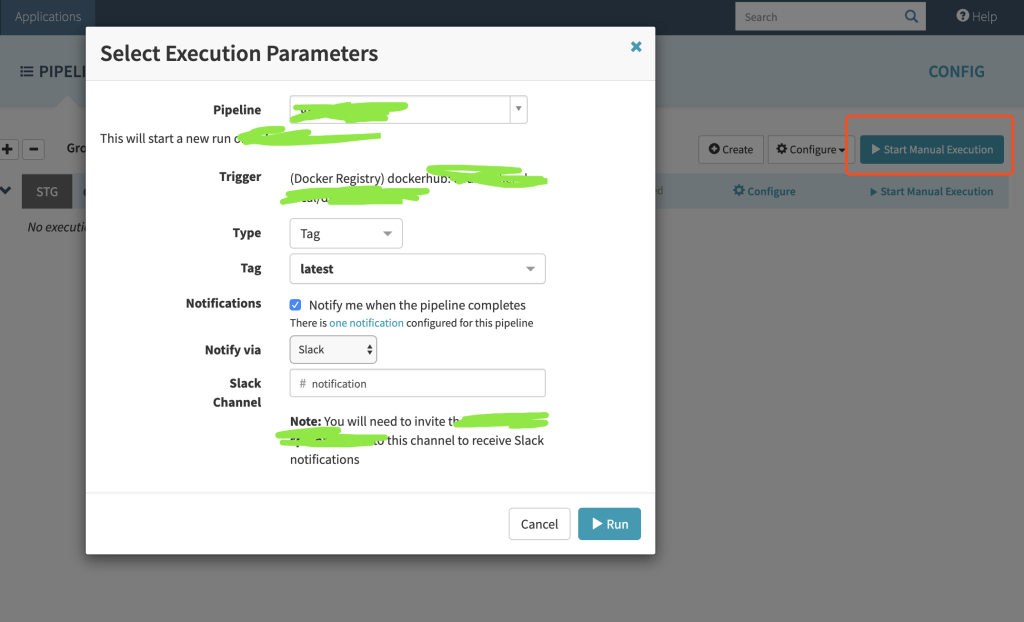
    3.Trigger the pipeline manually

    4.Check the deployment result

    P.S. Also you can check your k8s cluster whether the pods are deployed successfully.

     
  • Unknown's avatar

    Wang 12:43 on 2019-06-17 Permalink | Reply
    Tags: , ,   

    postwoman…

     
  • Unknown's avatar

    Wang 22:34 on 2019-05-10 Permalink | Reply
    Tags: , , ,   

    Kubernetes node in “NotReady” status 

    Rencetly I found some k8s nodes became “NotReady”, I checked disk and memory, they both seems fine.

    [xxx@xxx-xxx ~]# kubectl describe node xxx-xxx
    ...
    ...
    Conditions:
      Type             Status    LastHeartbeatTime                 LastTransitionTime                Reason                    Message
      ----             ------    -----------------                 ------------------                ------                    -------
      ...
      PIDPressure      False     Fri, 10 May 2019 09:24:43 +0900   Fri, 10 May 2018 00:10:12 +0900   KubeletHasSufficientPID   kubelet has sufficient PID available
      ...
    

    Then I restarted kubelet on server and checked logs, I found:

    [xxx@xxx-xxx ~]# systemctl status kubelet
    ● kubelet.service - Kubernetes Kubelet Server
       Loaded: loaded (/etc/systemd/system/kubelet.service; enabled; vendor preset: disabled)
    ...
    May 10 12:30:30 xxx-xxx kubelet[16776]: F0322 12:30:30.810434   16776 server.go:233] failed to run Kubelet: Running with swap on is not supported, plea...
    ...
    

    So I checked server’s status and turn off swap, then I restarted kubelet and the nodes went well.

    [xxx@xxx-xxx ~]# swapoff -a
    [xxx@xxx-xxx ~]# systemctl restart kubelet


  • Unknown's avatar

    Wang 21:20 on 2019-04-19 Permalink | Reply
    Tags: ,   

    Compile consul source code and generate executable scripts 

    Recently I have some special requirements which ask to compile consul source code and generate executable scripts, below are the general steps:

    1. Make sure you have installed docker, go, nodejs

    xxx@xxx consul $ docker version && node --version && go version
    Client: Docker Engine - Community
     Version:           18.09.2
     API version:       1.39
     Go version:        go1.10.8
     Git commit:        6247962
     Built:             Sun Feb 10 04:12:39 2019
     OS/Arch:           darwin/amd64
     Experimental:      false
    
    Server: Docker Engine - Community
     Engine:
      Version:          18.09.2
      API version:      1.39 (minimum version 1.12)
      Go version:       go1.10.6
      Git commit:       6247962
      Built:            Sun Feb 10 04:13:06 2019
      OS/Arch:          linux/amd64
      Experimental:     false
    v11.14.0
    go version go1.12.4 darwin/amd64
    

    2. Download consul source code

    cd $GO_HOME && mkdir -p src/github.com/hashicorp
    cd src/github.com/hashicorp
    git clone https://github.com/hashicorp/consul.git
    cd consul && git checkout v1.4.4 -b <BRANCH_NAME>
    

    3. Modify UI templates under ui-v2/app/templates/

    4. Compile & generate executable scripts

    export RELEASE_UNSIGNED=1
    export ALLOW_DIRTY_GIT=1
    sh build-support/scripts/release.sh --tag false --sign false --release <RELEASE_NAME>
    

    5. Test consul

    bin/consul agent 
               -datacenter='207' 
               -bind='10.49.32.224' 
               -bootstrap-expect=1 
               -data-dir="data/" 
               -log-level=INFO 
               -server 
               -ui
    

    NOTE:

    1. generate consul packages locations: bin/consul, pkg/bin, pkg/dist
    2. reference: https://github.com/hashicorp/consul/blob/master/.github/CONTRIBUTING.md
     
  • Unknown's avatar

    Wang 22:37 on 2019-04-10 Permalink | Reply
    Tags: , ,   

    Https certificate 

    There’s 3 kinds of https cerfiticate: DV(Domain validated), OV(Organization validated), EV(Organization validated).

    DV

    Most widely used SSL certificate, they only validate the domain name.

    OV

    Require more validation than DV certificate, there’s detail organization informations on certificate.

    EV

    Highest level of SSL/TLS certificate, browser will display organization’s name.

     
  • Unknown's avatar

    Wang 20:43 on 2019-03-13 Permalink | Reply
    Tags: ,   

    One Piece, my girl brought for me!

     
  • Unknown's avatar

    Wang 22:08 on 2019-03-07 Permalink | Reply
    Tags: , , ,   

    Consul with ACL 

    Enable ACL in Consul to protect your configurations, I deployed Consul by Helm.

     
  • Unknown's avatar

    Wang 22:54 on 2019-02-22 Permalink | Reply
    Tags: , ,   

    Xinhai Bay 2019!

     
  • Unknown's avatar

    Wang 22:12 on 2019-02-11 Permalink | Reply
    Tags: , , , , , , , , ,   

    Guarantee service availability in kubernetes 

    A good service not only provide good functionalities, but also ensure the availability and uptime.

    We reinforce our service from QoS, QPS, Throttling, Scaling, Throughput, Monitoring.

    Qos

    There’re 3 kinds of QoS in kubernetes: Guaranteed, Burstable, BestEffort. We usually use Guaranteed, Burstable for different services.

    #Guaranteed
    resources:
      requests:
        cpu: 1000m
        memory: 4Gi
      limits:
        cpu: 1000m
        memory: 4Gi
    
    #Burstable
    resources:
      requests:
        cpu: 1000m
        memory: 4Gi
      limits:
        cpu: 6000m
        memory: 8Gi
    
    QPS

    We did lots of stress test on APIs by Gatling before we release them, we mainly care about mean response time, std deviation, mean requests/sec, error rate (API Testing Report), during testing we monitor server metrics by Datadog to find out bottlenecks.

    We usually test APIs in two scenarios: internal, external. External testing result is much lower than internal testing because of network latency, network bandwidth and son on.

    Internal testing result

    ================================================================================
    ---- Global Information --------------------------------------------------------
    > request count                                     246000 (OK=246000 KO=0     )
    > min response time                                     16 (OK=16     KO=-     )
    > max response time                                   5891 (OK=5891   KO=-     )
    > mean response time                                    86 (OK=86     KO=-     )
    > std deviation                                        345 (OK=345    KO=-     )
    > response time 50th percentile                         30 (OK=30     KO=-     )
    > response time 75th percentile                         40 (OK=40     KO=-     )
    > response time 95th percentile                         88 (OK=88     KO=-     )
    > response time 99th percentile                       1940 (OK=1940   KO=-     )
    > mean requests/sec                                817.276 (OK=817.276 KO=-     )
    ---- Response Time Distraaibution ------------------------------------------------
    > t < 800 ms                                        240565 ( 98%)
    > 800 ms < t < 1200 ms                                1110 (  0%)
    > t > 1200 ms                                         4325 (  2%)
    > failed                                                 0 (  0%)
    ================================================================================
    

    External testing result

    ================================================================================
    ---- Global Information --------------------------------------------------------
    > request count                                      33000 (OK=32999  KO=1     )
    > min response time                                    477 (OK=477    KO=60001 )
    > max response time                                  60001 (OK=41751  KO=60001 )
    > mean response time                                   600 (OK=599    KO=60001 )
    > std deviation                                        584 (OK=484    KO=0     )
    > response time 50th percentile                        497 (OK=497    KO=60001 )
    > response time 75th percentile                        506 (OK=506    KO=60001 )
    > response time 95th percentile                       1366 (OK=1366   KO=60001 )
    > response time 99th percentile                       2125 (OK=2122   KO=60001 )
    > mean requests/sec                                109.635 (OK=109.631 KO=0.003 )
    ---- Response Time Distribution ------------------------------------------------
    > t < 800 ms                                         29826 ( 90%)
    > 800 ms < t < 1200 ms                                1166 (  4%)
    > t > 1200 ms                                         2007 (  6%)
    > failed                                                 1 (  0%)
    ---- Errors --------------------------------------------------------------------
    > i.g.h.c.i.RequestTimeoutException: Request timeout after 60000      1 (100.0%)
     ms
    ================================================================================
    
    Throttling

    We throttle API by Nginx limit, we configured ingress like this:

    annotations:
      nginx.ingress.kubernetes.io/limit-connections: '30'
      nginx.ingress.kubernetes.io/limit-rps: '60'
    

    And it will generate Nginx configuration dynamically like this:

    limit_conn_zone $limit_ZGVsaXZlcnktY2RuYV9kc2QtYXBpLWNkbmEtZ2F0ZXdheQ zone=xxx_conn:5m;
    limit_req_zone $limit_ZGVsaXZlcnktY2RuYV9kc2QtYXBpLWNkbmEtZ2F0ZXdheQ zone=xxx_rps:5m rate=60r/s;
    
    server {
        server_name xxx.xxx ;
        listen 80;
        
        location ~* "^/xxx/?(?<baseuri>.*)" {
            ...
            ...        
            limit_conn xxx_conn 30;
            limit_req zone=xxx_rps burst=300 nodelay;
            ...
            ...        
    }
    
    Scaling

    We use HPA in kubernetes to ensure auto (Auto scaling in kubernetes), you could check HPA status in server:

    [xxx@xxx ~]$ kubectl get hpa -n test-ns
    NAME       REFERENCE             TARGETS           MINPODS   MAXPODS   REPLICAS   AGE
    api-demo   Deployment/api-demo   39%/30%, 0%/30%   3         10        3          126d
    
    [xxx@xxx ~]$ kubectl get pod -n test-ns
    NAME                           READY     STATUS    RESTARTS   AGE
    api-demo-76b9954f57-6hvzx      1/1       Running   0          126d
    api-demo-76b9954f57-mllsx      1/1       Running   0          126d
    api-demo-76b9954f57-s22k8      1/1       Running   0          126d
    
    
    Throughput & Monitoring

    We integrated Datadog for monitoring(Monitoring by Datadog), we could check detail API metrics from various dashboards.

    Also we could calculate throughout from user, request, request time.

     
c
Compose new post
j
Next post/Next comment
k
Previous post/Previous comment
r
Reply
e
Edit
o
Show/Hide comments
t
Go to top
l
Go to login
h
Show/Hide help
shift + esc
Cancel