SpringOne Platform 2019 in Austin, https://springoneplatform.io/


SpringOne Platform 2019 in Austin, https://springoneplatform.io/
Cloud platforms provide a wealth of benefits for the organizations that use them. However, there’s no denying that adopting the cloud can put strains on DevOps teams. Developers must use microservices to architect for portability, meanwhile operators are managing extremely large hybrid and multi-cloud deployments. Istio lets you connect, secure, control, and observe services.
First, download Istio release version, unzip the package and enter the directory.
Second, verify installation environment
bin/istioctl verify-install
Next, deploy Istio and select the demo profile which enable many features like tracing/kiali/grafana
bin/istioctl manifest apply --set profile=demo
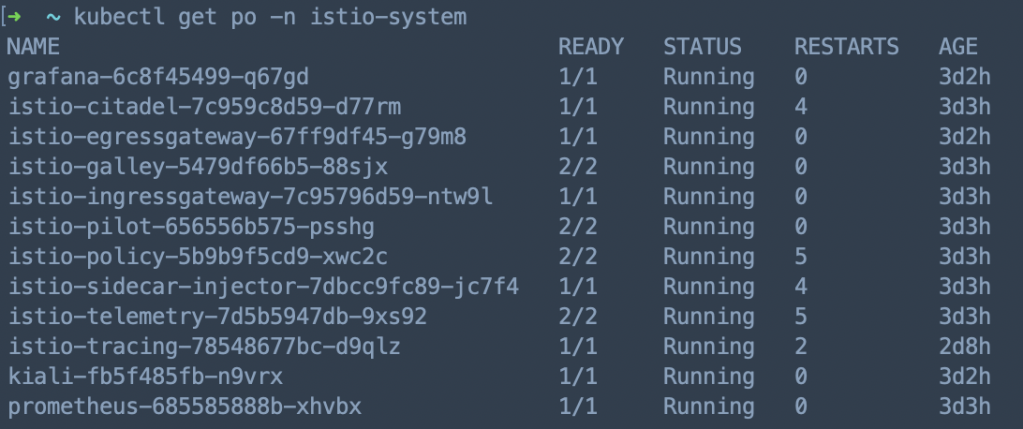
Then, check Istio pods’ status, make sure all the related pods are running
Istio Commands
istioctl experimental authz)esrally is a benchmark tool for elasticsearch, https://github.com/elastic/rally
Testing Script:
esrally --pipeline=benchmark-only --target-hosts=server1:9200,server2:9200,server3:9200,server4:9200,server5:9200
Server status in Kibana dashboard:
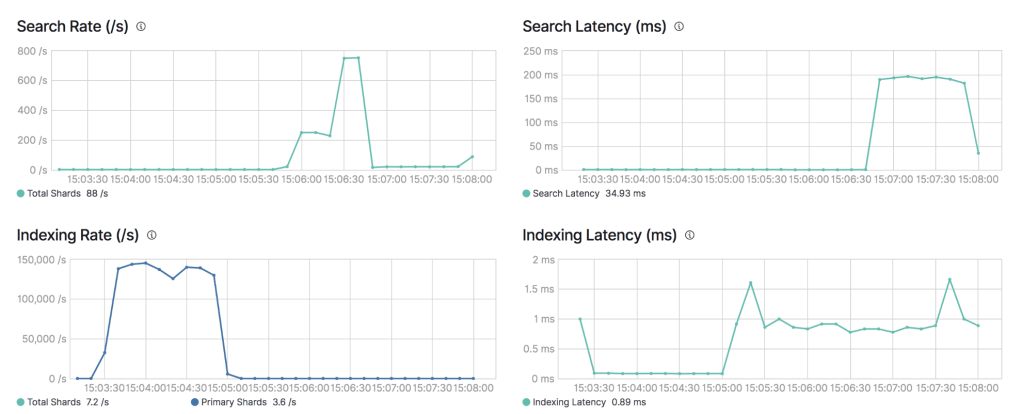
P.S. Please benchmark your ES cluster based on your real business scenario & cluster topology
Rencetly I found some k8s nodes became “NotReady”, I checked disk and memory, they both seems fine.
[xxx@xxx-xxx ~]# kubectl describe node xxx-xxx
...
...
Conditions:
  Type             Status    LastHeartbeatTime                 LastTransitionTime                Reason                    Message
  ----             ------    -----------------                 ------------------                ------                    -------
  ...
  PIDPressure      False     Fri, 10 May 2019 09:24:43 +0900   Fri, 10 May 2018 00:10:12 +0900   KubeletHasSufficientPID   kubelet has sufficient PID available
  ...
Then I restarted kubelet on server and checked logs, I found:
[xxx@xxx-xxx ~]# systemctl status kubelet
● kubelet.service - Kubernetes Kubelet Server
   Loaded: loaded (/etc/systemd/system/kubelet.service; enabled; vendor preset: disabled)
...
May 10 12:30:30 xxx-xxx kubelet[16776]: F0322 12:30:30.810434   16776 server.go:233] failed to run Kubelet: Running with swap on is not supported, plea...
...
So I checked server’s status and turn off swap, then I restarted kubelet and the nodes went well.
[xxx@xxx-xxx ~]# swapoff -a
[xxx@xxx-xxx ~]# systemctl restart kubelet
A good service not only provide good functionalities, but also ensure the availability and uptime.
We reinforce our service from QoS, QPS, Throttling, Scaling, Throughput, Monitoring.
There’re 3 kinds of QoS in kubernetes: Guaranteed, Burstable, BestEffort. We usually use Guaranteed, Burstable for different services.
#Guaranteed
resources:
  requests:
    cpu: 1000m
    memory: 4Gi
  limits:
    cpu: 1000m
    memory: 4Gi

#Burstable
resources:
  requests:
    cpu: 1000m
    memory: 4Gi
  limits:
    cpu: 6000m
    memory: 8Gi
We did lots of stress test on APIs by Gatling before we release them, we mainly care about mean response time, std deviation, mean requests/sec, error rate (API Testing Report), during testing we monitor server metrics by Datadog to find out bottlenecks.
We usually test APIs in two scenarios: internal, external. External testing result is much lower than internal testing because of network latency, network bandwidth and son on.
Internal testing result
================================================================================
---- Global Information --------------------------------------------------------
> request count                                     246000 (OK=246000 KO=0     )
> min response time                                     16 (OK=16     KO=-     )
> max response time                                   5891 (OK=5891   KO=-     )
> mean response time                                    86 (OK=86     KO=-     )
> std deviation                                        345 (OK=345    KO=-     )
> response time 50th percentile                         30 (OK=30     KO=-     )
> response time 75th percentile                         40 (OK=40     KO=-     )
> response time 95th percentile                         88 (OK=88     KO=-     )
> response time 99th percentile                       1940 (OK=1940   KO=-     )
> mean requests/sec                                817.276 (OK=817.276 KO=-     )
---- Response Time Distraaibution ------------------------------------------------
> t < 800 ms                                        240565 ( 98%)
> 800 ms < t < 1200 ms                                1110 (  0%)
> t > 1200 ms                                         4325 (  2%)
> failed                                                 0 (  0%)
================================================================================
External testing result
================================================================================
---- Global Information --------------------------------------------------------
> request count                                      33000 (OK=32999  KO=1     )
> min response time                                    477 (OK=477    KO=60001 )
> max response time                                  60001 (OK=41751  KO=60001 )
> mean response time                                   600 (OK=599    KO=60001 )
> std deviation                                        584 (OK=484    KO=0     )
> response time 50th percentile                        497 (OK=497    KO=60001 )
> response time 75th percentile                        506 (OK=506    KO=60001 )
> response time 95th percentile                       1366 (OK=1366   KO=60001 )
> response time 99th percentile                       2125 (OK=2122   KO=60001 )
> mean requests/sec                                109.635 (OK=109.631 KO=0.003 )
---- Response Time Distribution ------------------------------------------------
> t < 800 ms                                         29826 ( 90%)
> 800 ms < t < 1200 ms                                1166 (  4%)
> t > 1200 ms                                         2007 (  6%)
> failed                                                 1 (  0%)
---- Errors --------------------------------------------------------------------
> i.g.h.c.i.RequestTimeoutException: Request timeout after 60000      1 (100.0%)
 ms
================================================================================
We throttle API by Nginx limit, we configured ingress like this:
annotations:
  nginx.ingress.kubernetes.io/limit-connections: '30'
  nginx.ingress.kubernetes.io/limit-rps: '60'
And it will generate Nginx configuration dynamically like this:
limit_conn_zone $limit_ZGVsaXZlcnktY2RuYV9kc2QtYXBpLWNkbmEtZ2F0ZXdheQ zone=xxx_conn:5m;
limit_req_zone $limit_ZGVsaXZlcnktY2RuYV9kc2QtYXBpLWNkbmEtZ2F0ZXdheQ zone=xxx_rps:5m rate=60r/s;

server {
    server_name xxx.xxx ;
    listen 80;

    location ~* "^/xxx/?(?<baseuri>.*)" {
        ...
        ...
        limit_conn xxx_conn 30;
        limit_req zone=xxx_rps burst=300 nodelay;
        ...
        ...
}
We use HPA in kubernetes to ensure auto (Auto scaling in kubernetes), you could check HPA status in server:
[xxx@xxx ~]$ kubectl get hpa -n test-ns
NAME       REFERENCE             TARGETS           MINPODS   MAXPODS   REPLICAS   AGE
api-demo   Deployment/api-demo   39%/30%, 0%/30%   3         10        3          126d

[xxx@xxx ~]$ kubectl get pod -n test-ns
NAME                           READY     STATUS    RESTARTS   AGE
api-demo-76b9954f57-6hvzx      1/1       Running   0          126d
api-demo-76b9954f57-mllsx      1/1       Running   0          126d
api-demo-76b9954f57-s22k8      1/1       Running   0          126d
We integrated Datadog for monitoring(Monitoring by Datadog), we could check detail API metrics from various dashboards.
Also we could calculate throughout from user, request, request time.
We have thousands of containers running on hundreds of servers, so we need comprehensive monitoring system to monitor service and server metrics.
We investigated popular cloud monitoring platform: New Relic and Datadog, finally we decided to use datadog.
Dashboard: Datadog could detect services and configure dashboards for you automatically.
Container & Process: You could check all your containers & process in all environments clearly.

Monitors: Datadog will create monitors according to service type automatically, if it doesn’t your requirement, you could create your own. It’s also convenient to send alert message through Slack, Email.
APM: Datadog provide various charts for API analysis, also there’s Service Map which you could check service dependencies.
Synthetics: New feature in Datadog which could test your API around the world to check availability and uptime.
As we know RESTful API is stateless, every request will be forward to backend server by round robin mechanism.
But in some scenario we need sticky session which means request from one client should be forward to one backend server.
After checking kubernetes documentation we added some annotations under ingress configuration, and it works well.
annotations:
  nginx.ingress.kubernetes.io/affinity: "cookie"
  nginx.ingress.kubernetes.io/session-cookie-name: "router"
  nginx.ingress.kubernetes.io/session-cookie-hash: "sha1"
If you open Developer Tools in Chrome, you will find the cookie.

For security issue we decided to enable LDAP in presto, to deploy presto into kubernetes cluster we build presto image ourselves which include kerberos authentication and LDAP configurations.
As you see the image structure, configurations under catalog/etc/hive are very important, please pay attention.

krb5.conf and xxx.keytab are used to connect to kerberos
password-authenticator.properties and ldap_server.pem under etc, hive.properties and hive-security.json under catalog are used to connect to LDAP.
password-authenticator.properties
password-authenticator.name=ldap
ldap.url=ldaps://<IP>:<PORT>
ldap.user-bind-pattern=xxxxxx
ldap.user-base-dn=xxxxxx
hive.properties
connector.name=hive-hadoop2
hive.security=file
security.config-file=<hive-security.json>
hive.metastore.authentication.type=KERBEROS
hive.metastore.uri=thrift://<IP>:<PORT>
hive.metastore.service.principal=<SERVER-PRINCIPAL>
hive.metastore.client.principal=<CLIENT-PRINCIPAL>
hive.metastore.client.keytab=<KEYTAB>
hive.config.resources=core-site.xml, hdfs-site.xml
hive-security.json
{
  "schemas": [{
    "user": "user_1",
    "schema": "db_1",
    "owner": false
  }, {
    "user": " ",
    "schema": "db_1",
    "owner": false
  }, {
    "user": "user_2",
    "schema": "db_2",
    "owner": false
  }],
  "tables": [{
    "user": "user_1",
    "schema": "db_1",
    "table": "table_1",
    "privileges": ["SELECT"]
  }, {
    "user": "user_1",
    "schema": "db_1",
    "table": "table_2",
    "privileges": ["SELECT"]
  }, {
    "user": "user_2",
    "schema": "db_1",
    "table": ".*",
    "privileges": ["SELECT"]
  }, {
    "user": "user_2",
    "schema": "db_2",
    "table": "table_1",
    "privileges": ["SELECT"]
  }, {
    "user": "user_2",
    "schema": "db_2",
    "table": "table_2",
    "privileges": ["SELECT"]
  }],
  "sessionProperties": [{
    "allow": false
  }]
}
We build deployment pipeline by Jenkins, Git, Maven, Docker, JFrog, Kubernetes, Slack, below is overall process:
develop -> create branch -> push code -> git hook -> jenkins build -> code check -> unit test -> docker build -> push docker image -> deploy -> notificationa
For every project we generate pipeline scripts by JHipster like this:

ci contains docker related scripts, cd contains kubernetes related scripts.
We configured Jenkins to scan projects from git automatically which followed naming rule, if any changes on git, Jenkins will pull the code and start building.

There are 3 ways to expose your service: NodePort, LoadBalancer, Ingress, next I will introduce about how to use ingress.
1.Deploy ingress controller
You need deploy ingress controller at first which will start nginx pods, then nginx will bind domains and listen to the requests.
I built a common ingress chart for different service, I only need change values-<service>.yaml and deploy script if any changes.

Another key point is that you must be clear about ingress-class, different service use different ingress-class, it will be quite messy if you mistake them.
args:
  - /nginx-ingress-controller
  - --default-backend-service=$(POD_NAMESPACE)/default-http-backend
  - --configmap=$(POD_NAMESPACE)/nginx-configuration
  - --tcp-services-configmap=$(POD_NAMESPACE)/tcp-services
  - --udp-services-configmap=$(POD_NAMESPACE)/udp-services
  - --ingress-class={{ .Values.server.namespace }}
  - --sort-backends=true
2.Configure service ingress
Next we need configure service ingress which will append nginx server configuration dynamically.
I also built a service chart which include environment configurations, Jenkins & Helm will use different values-<env>.yaml when execute pipeline deployment.

Ingress example:
apiVersion: extensions/v1beta1
kind: Ingress
metadata:
  name: {{ .Values.app.name }}{{ .Values.deploy.subfix }}
  namespace: {{ .Values.app.namespace }}
  annotations:
    kubernetes.io/ingress.class: "{{ .Values.ingress.class }}"
    kubernetes.io/tls-acme: "true"
    nginx.ingress.kubernetes.io/enable-cors: "false"
    nginx.ingress.kubernetes.io/rewrite-target: /
    nginx.ingress.kubernetes.io/proxy-body-size: 10m
spec:
  rules:
  - host: {{ .Values.ingress.hostname }}
    http:
      paths:
      - path: {{ .Values.ingress.path }}
        backend:
          serviceName: {{ .Values.app.name }}{{ .Values.deploy.subfix }}
          servicePort: {{ .Values.container.port }}

Reply