There’s two kinds of probe: readinessProbe, livenessProbe in kubernetes used to detect if your service is healthy.
We encountered a problem when configured readinessProbe, there’s a property named initialDelaySeconds which indicate kubernetes will start health check after specific second, we used the default value 60 which means kubernetes will check health after 60 seconds.
As we deployed over 20 StatefulSet pods and these pods joined as a cluster which cost over 60 seconds, kubernetes can’t ping service successfully so that kubernetes restart these pods, thees pods restart in loop all the time.
After we increased the initialDelaySeconds to 120, everything goes fine.
If you deploy pod by setting “kind: Deployment“, you will lost your data when the pod restart or being deleted.
It’s not acceptable when we want to deploy storage system like Redis, Elasticsearch, in this case we need use StatefulSet.
For the concrete explanation please refer to the official documentation, StatefulSet use PVC(Persistent Volume Claim) as storage, and it will exist all the time no matter what happened to the pod.
You must specify PVC in StatefulSet’s yaml file like this:
When we deploy a API in kubernets we must define replication number for the pod, but as we know there will be high traffic during peak time and we usually can’t estimate service capacity exactly at first time, in this case we must scale our service like creating more pods to share online traffic to avoid service crash down.
We usually scale service manually before using kubernetes, append more nodes during peak time and destroy nodes when the traffic became smooth.
In kubernetes there’s a kind of feature called HPA(Horizontal Pod Autoscaler) which could help your scale service automatically. You could specify minimum and maximum replica number in yaml file, HPA will monitor pod’s CPU and Memory by collecting pod’s metric, if HPA found your pod’s metric is over the threshold number which you defined in yaml file, it will create more pods automatically and join the service cluster to load the traffic.
As you know kubernetes is the most popular container orchestration tool which helps us deploy/manage/scale container and service more easily.
We deploy kubernetes cluster by kuberspray which could help us build production ready cluster very fast and provide many convenient tools. Before start deploying you must configure SSH key between nodes.
For data security, hadoop cluster usually implement different security mechanisms, most commonly used mechanism is kerberos. Recently I tested how to connect hive by kerberos in presto.
1.Add krb5.conf/keytab/hdfs-site.xml/core-site.xml in every node.
Days before I have installed presto and ambari separately, officially ambari doesn’t support presto, you have to download ambari-presto-service and configure it yourself if you wanna manage presto on ambari.
version=`hdp-select status hadoop-client | sed 's/hadoop-client - ([0-9].[0-9]).*/1/'`
mkdir /var/lib/ambari-server/resources/stacks/HDP/$version/services/PRESTO
wget https://github.com/prestodb/ambari-presto-service/releases/download/v1.2/ambari-presto-1.2.tar.gz
tar -xvf ambari-presto-1.2.tar.gz -C /var/lib/ambari-server/resources/stacks/HDP/$version/services/PRESTO
mv /var/lib/ambari-server/resources/stacks/HDP/$version/services/PRESTO/ambari-presto-1.2/* /var/lib/ambari-server/resources/stacks/HDP/$version/services/PRESTO
rm -rf /var/lib/ambari-server/resources/stacks/HDP/$version/services/PRESTO/ambari-presto-1.2
chmod -R +x /var/lib/ambari-server/resources/stacks/HDP/$version/services/PRESTO/*
3.restart ambari-server
ambari-server restart
4.add presto service on ambari, please configure discovery.uri when you add presto service, e.g. discovery.uri: http://coordinator:8285
After doing this, you could add catalogs and use presto as query engine.
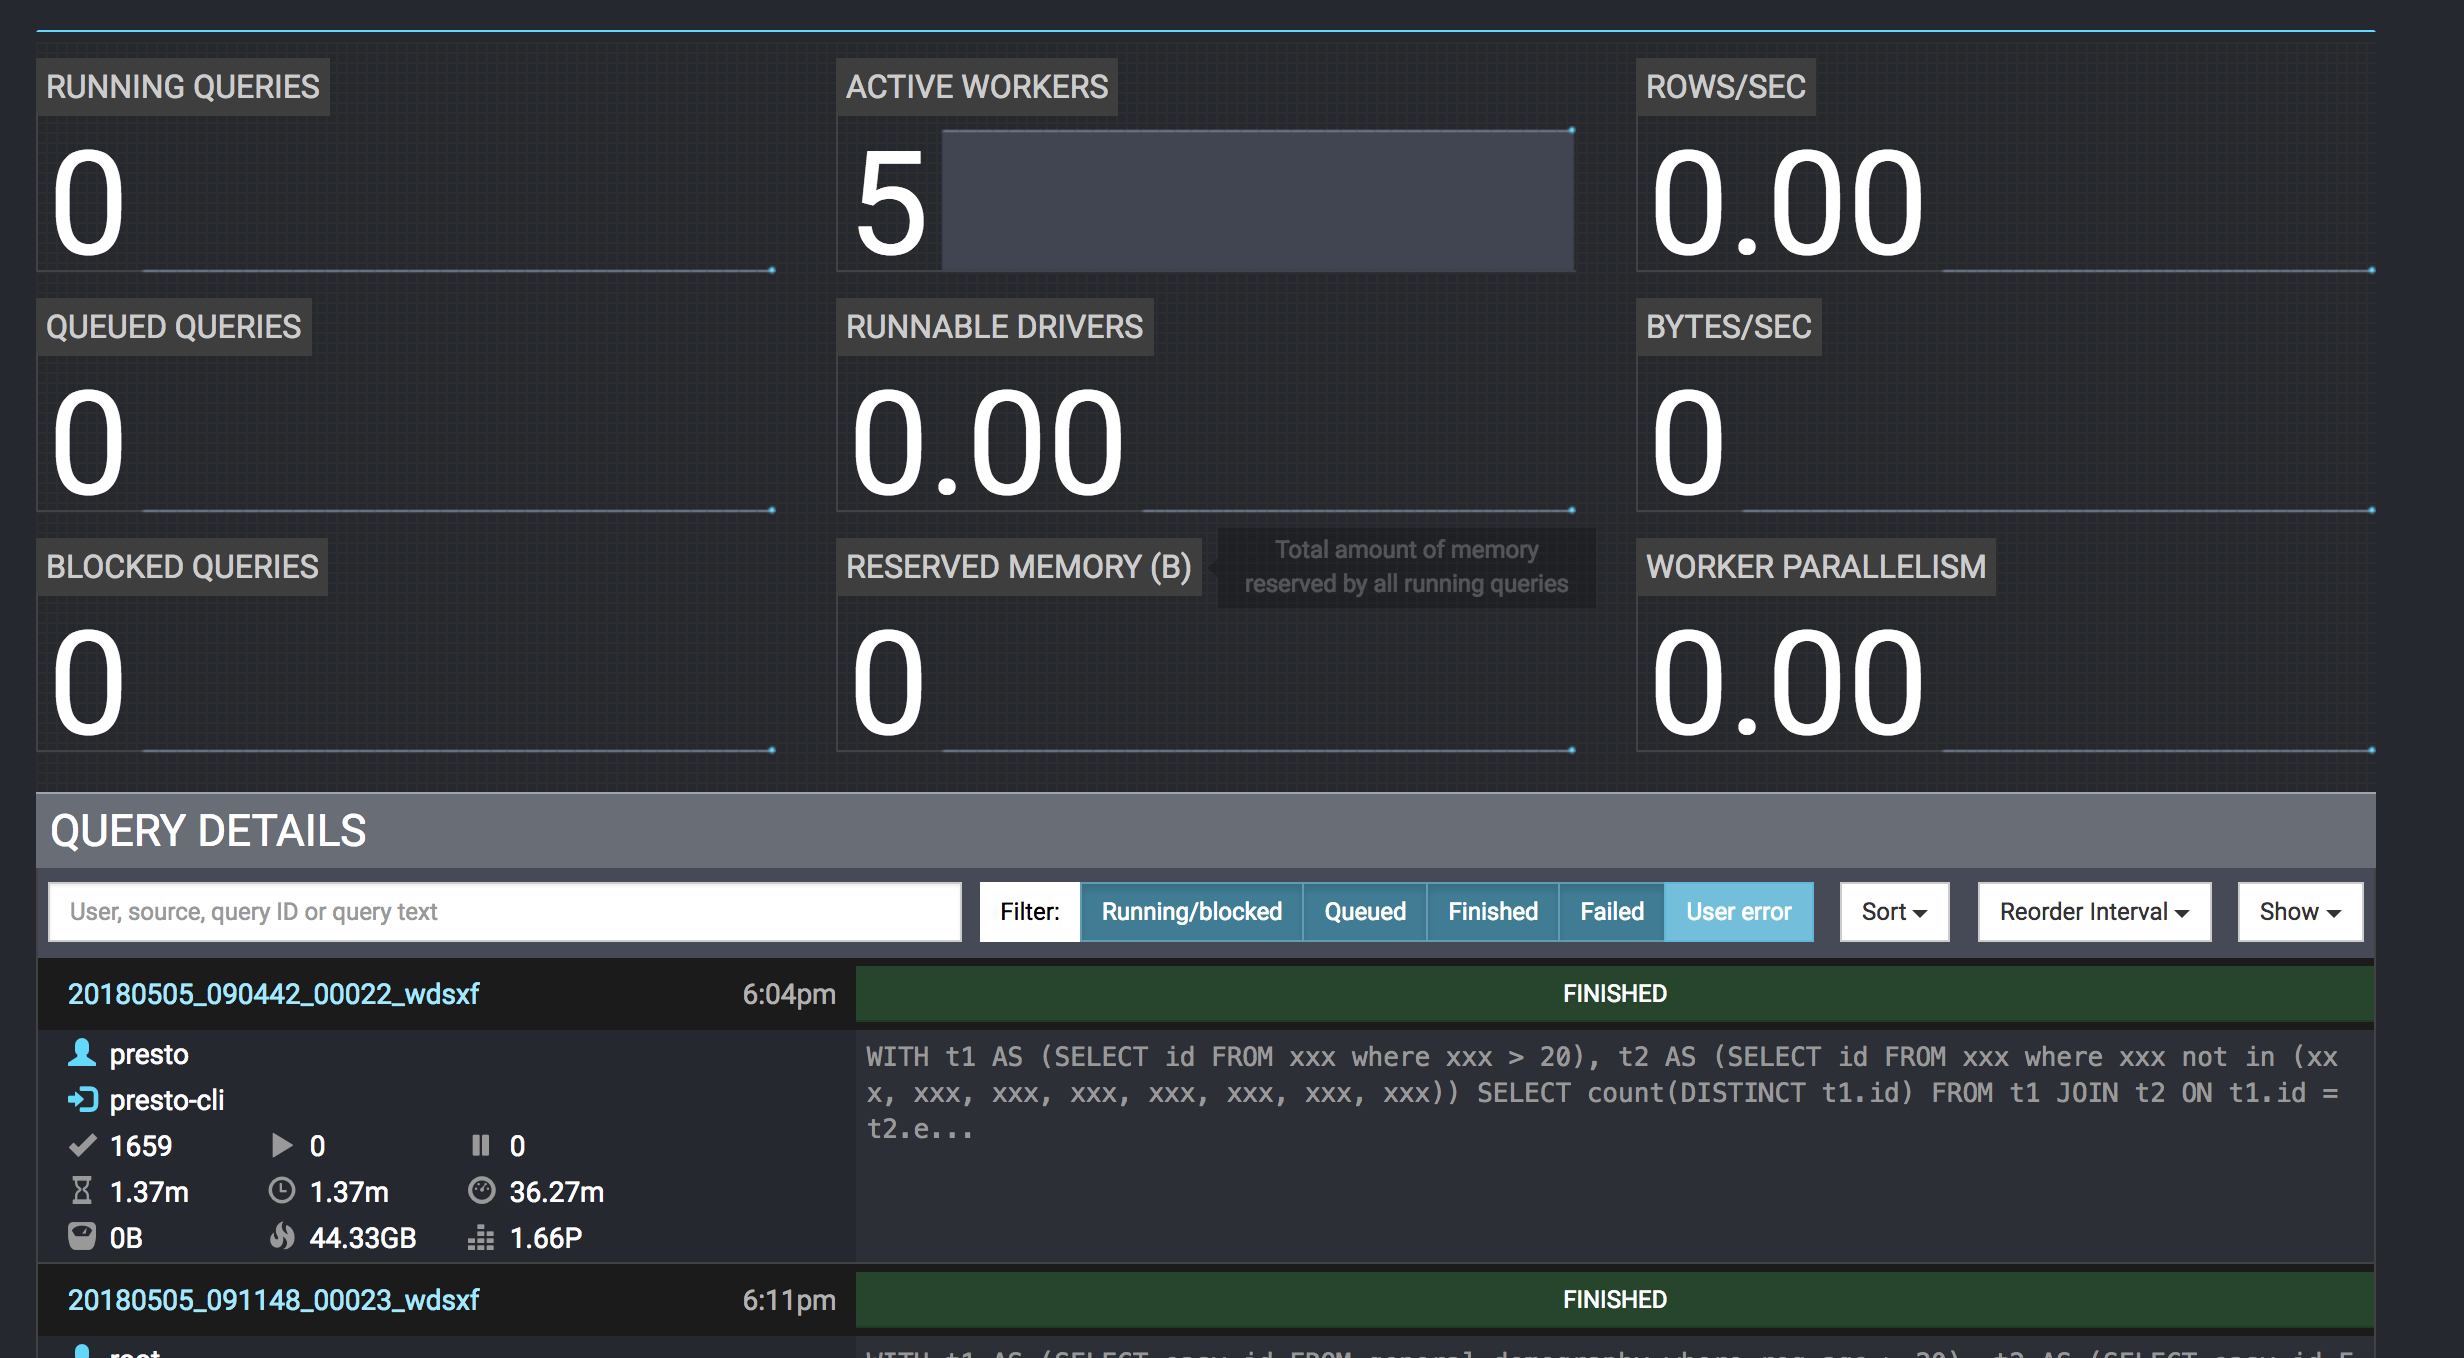
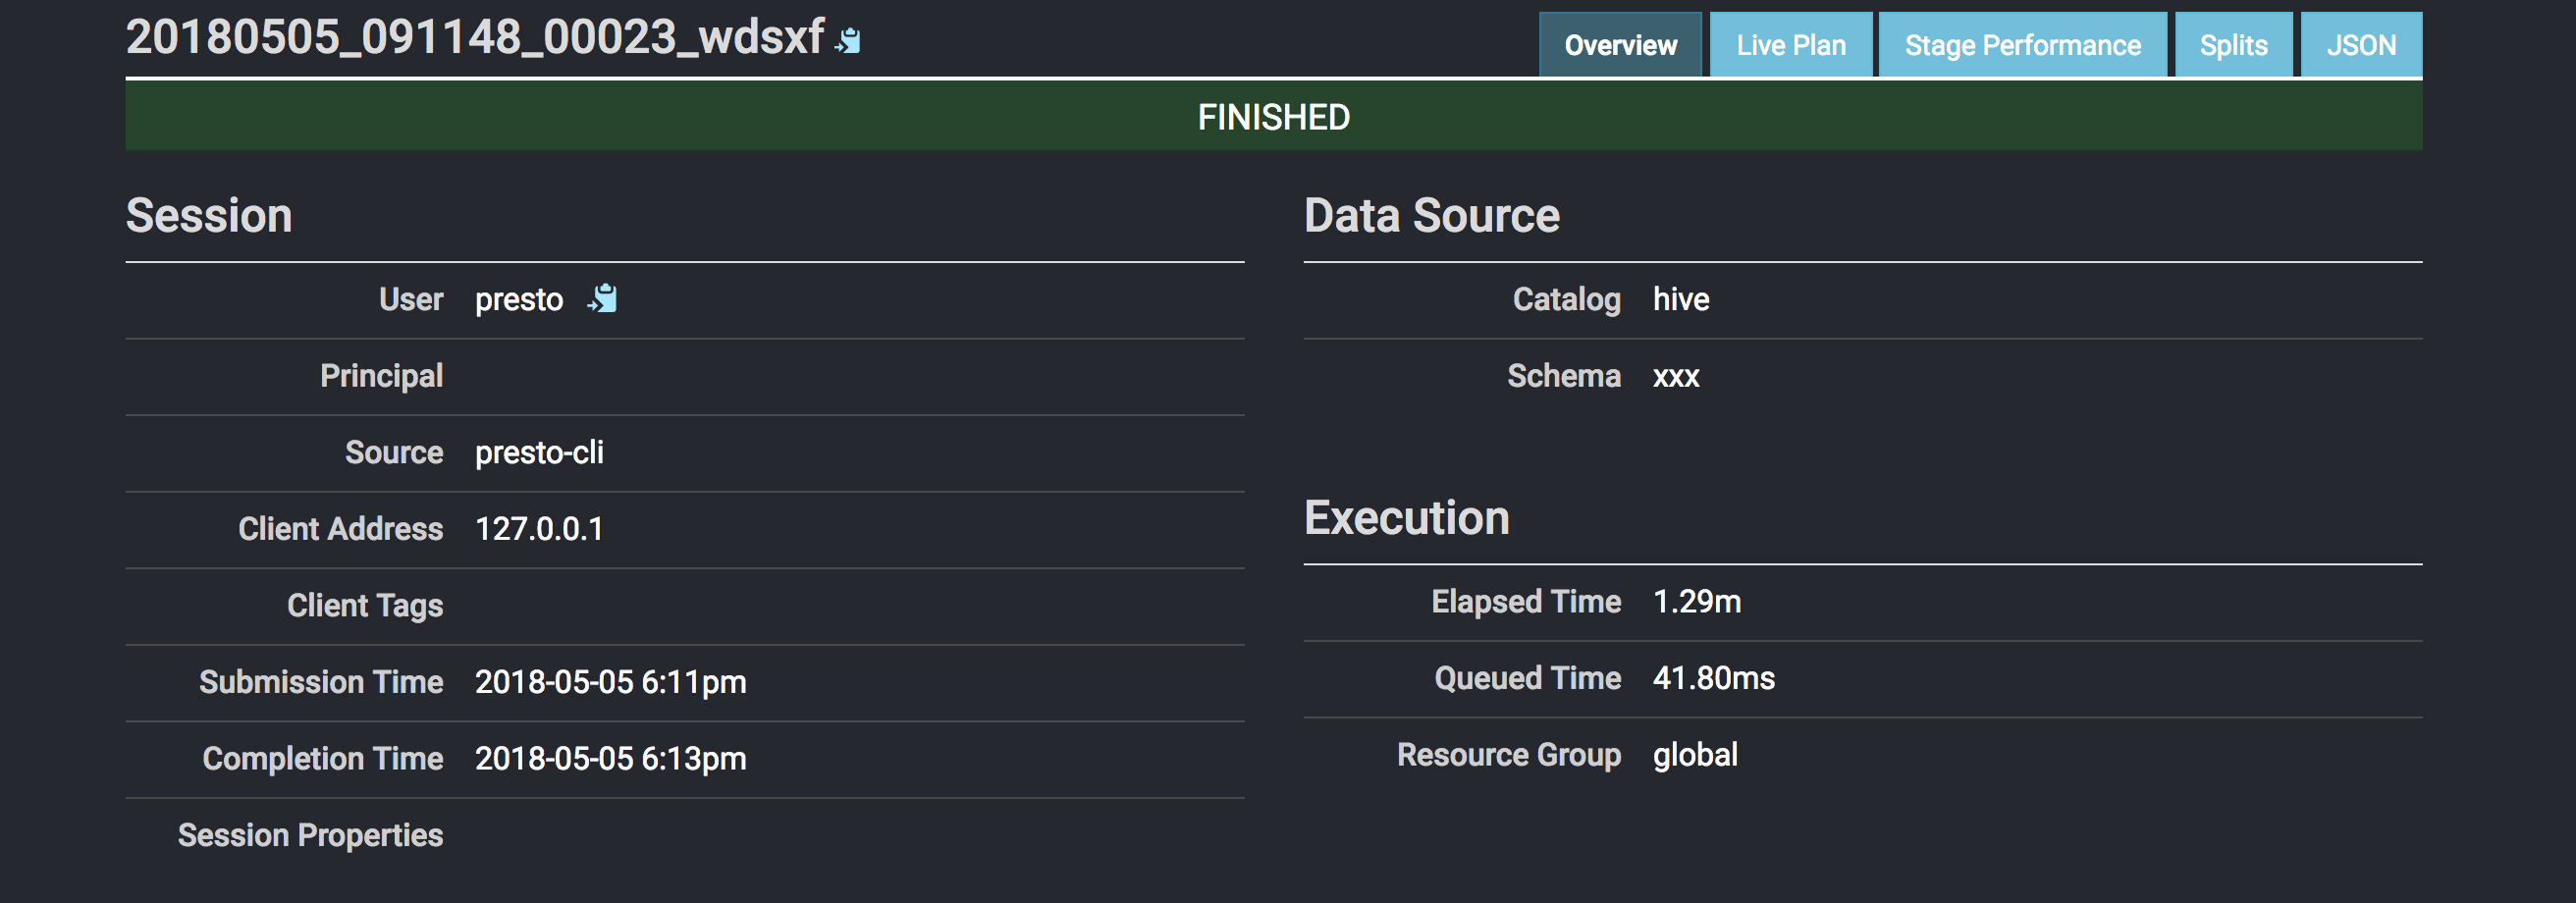
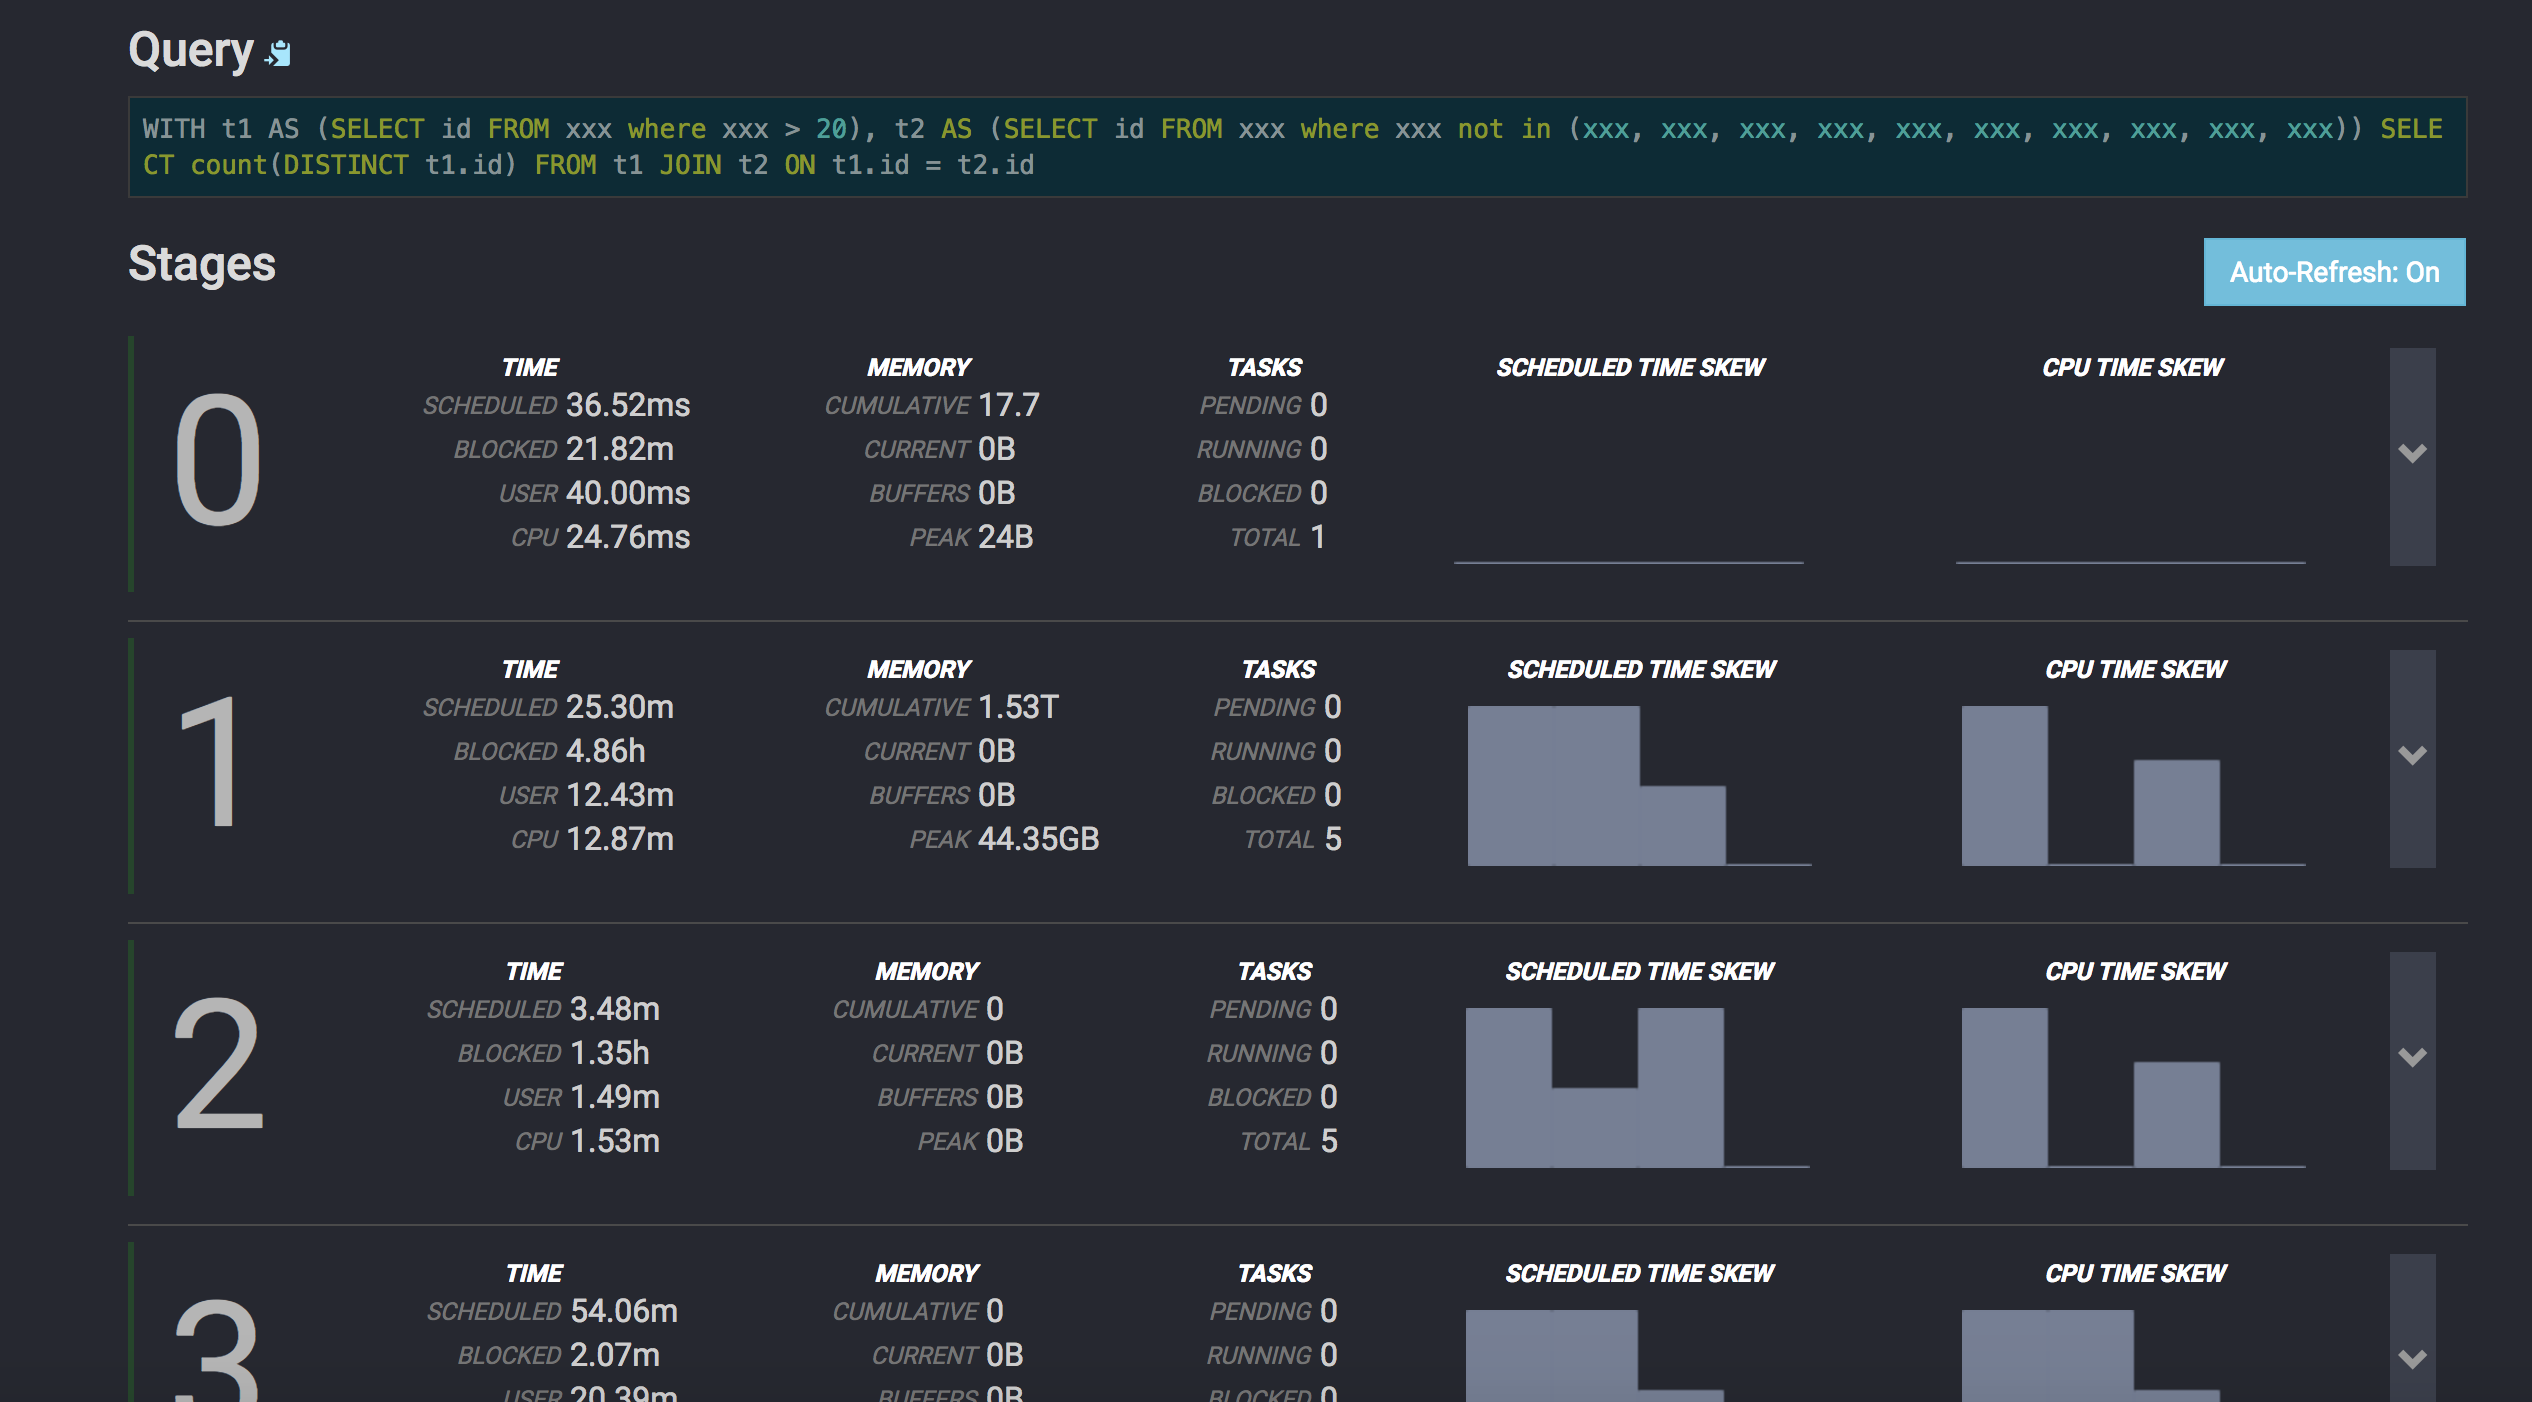
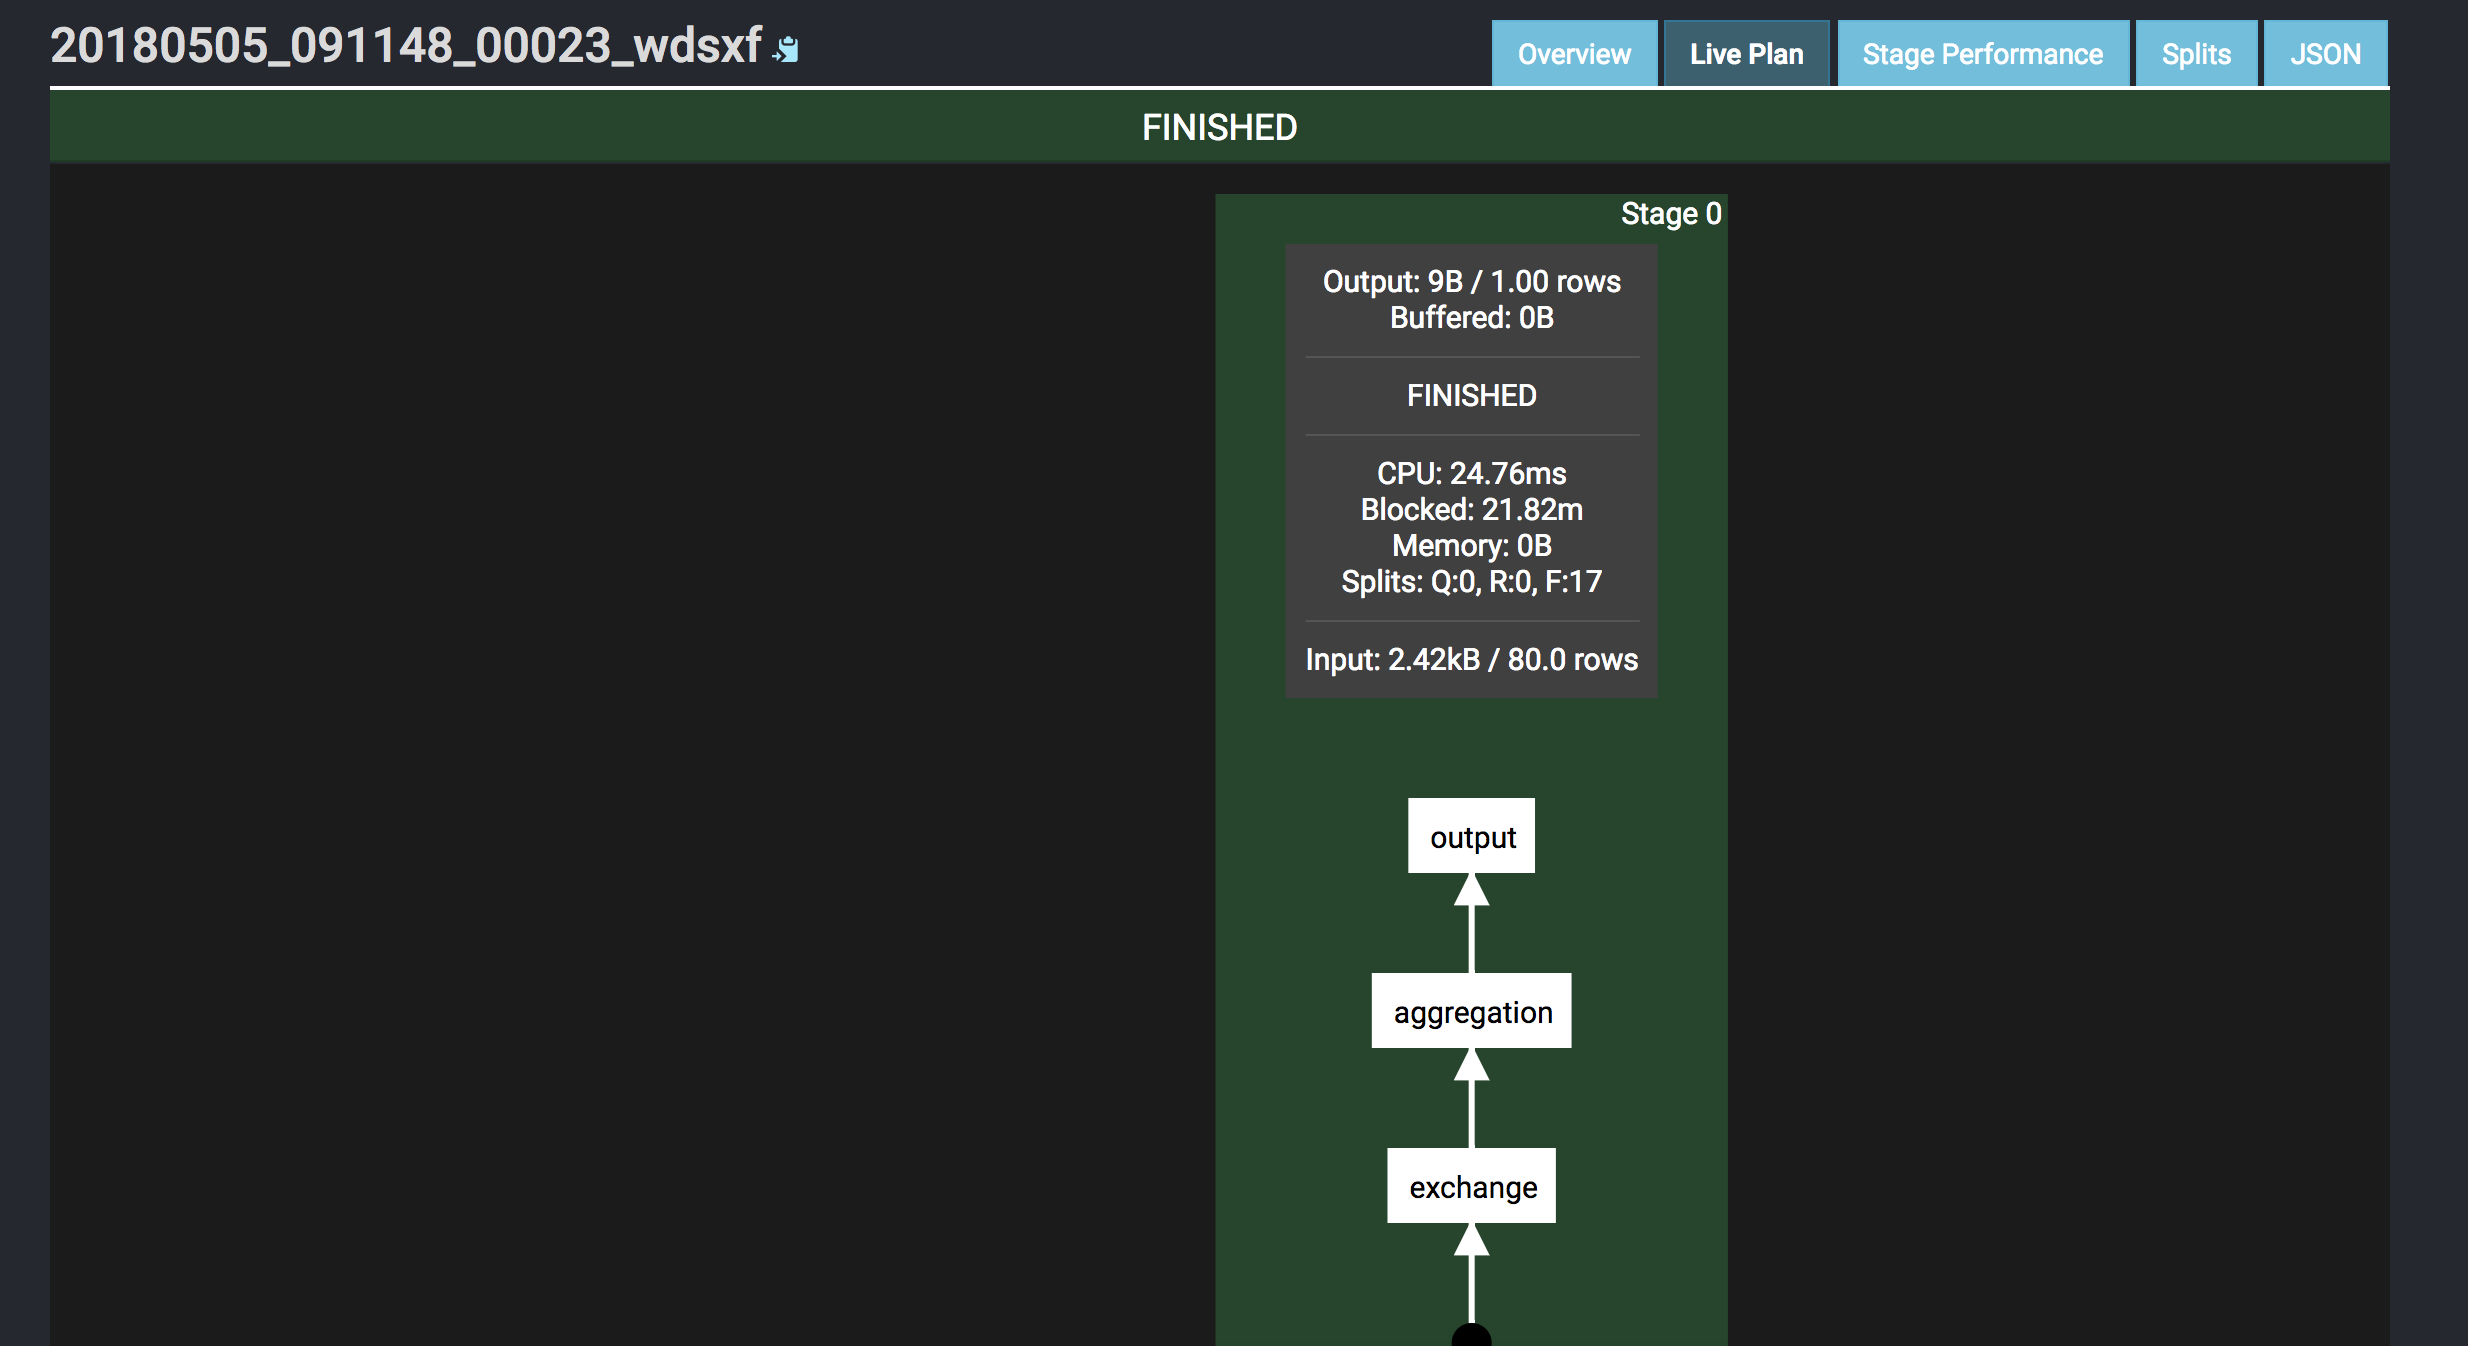
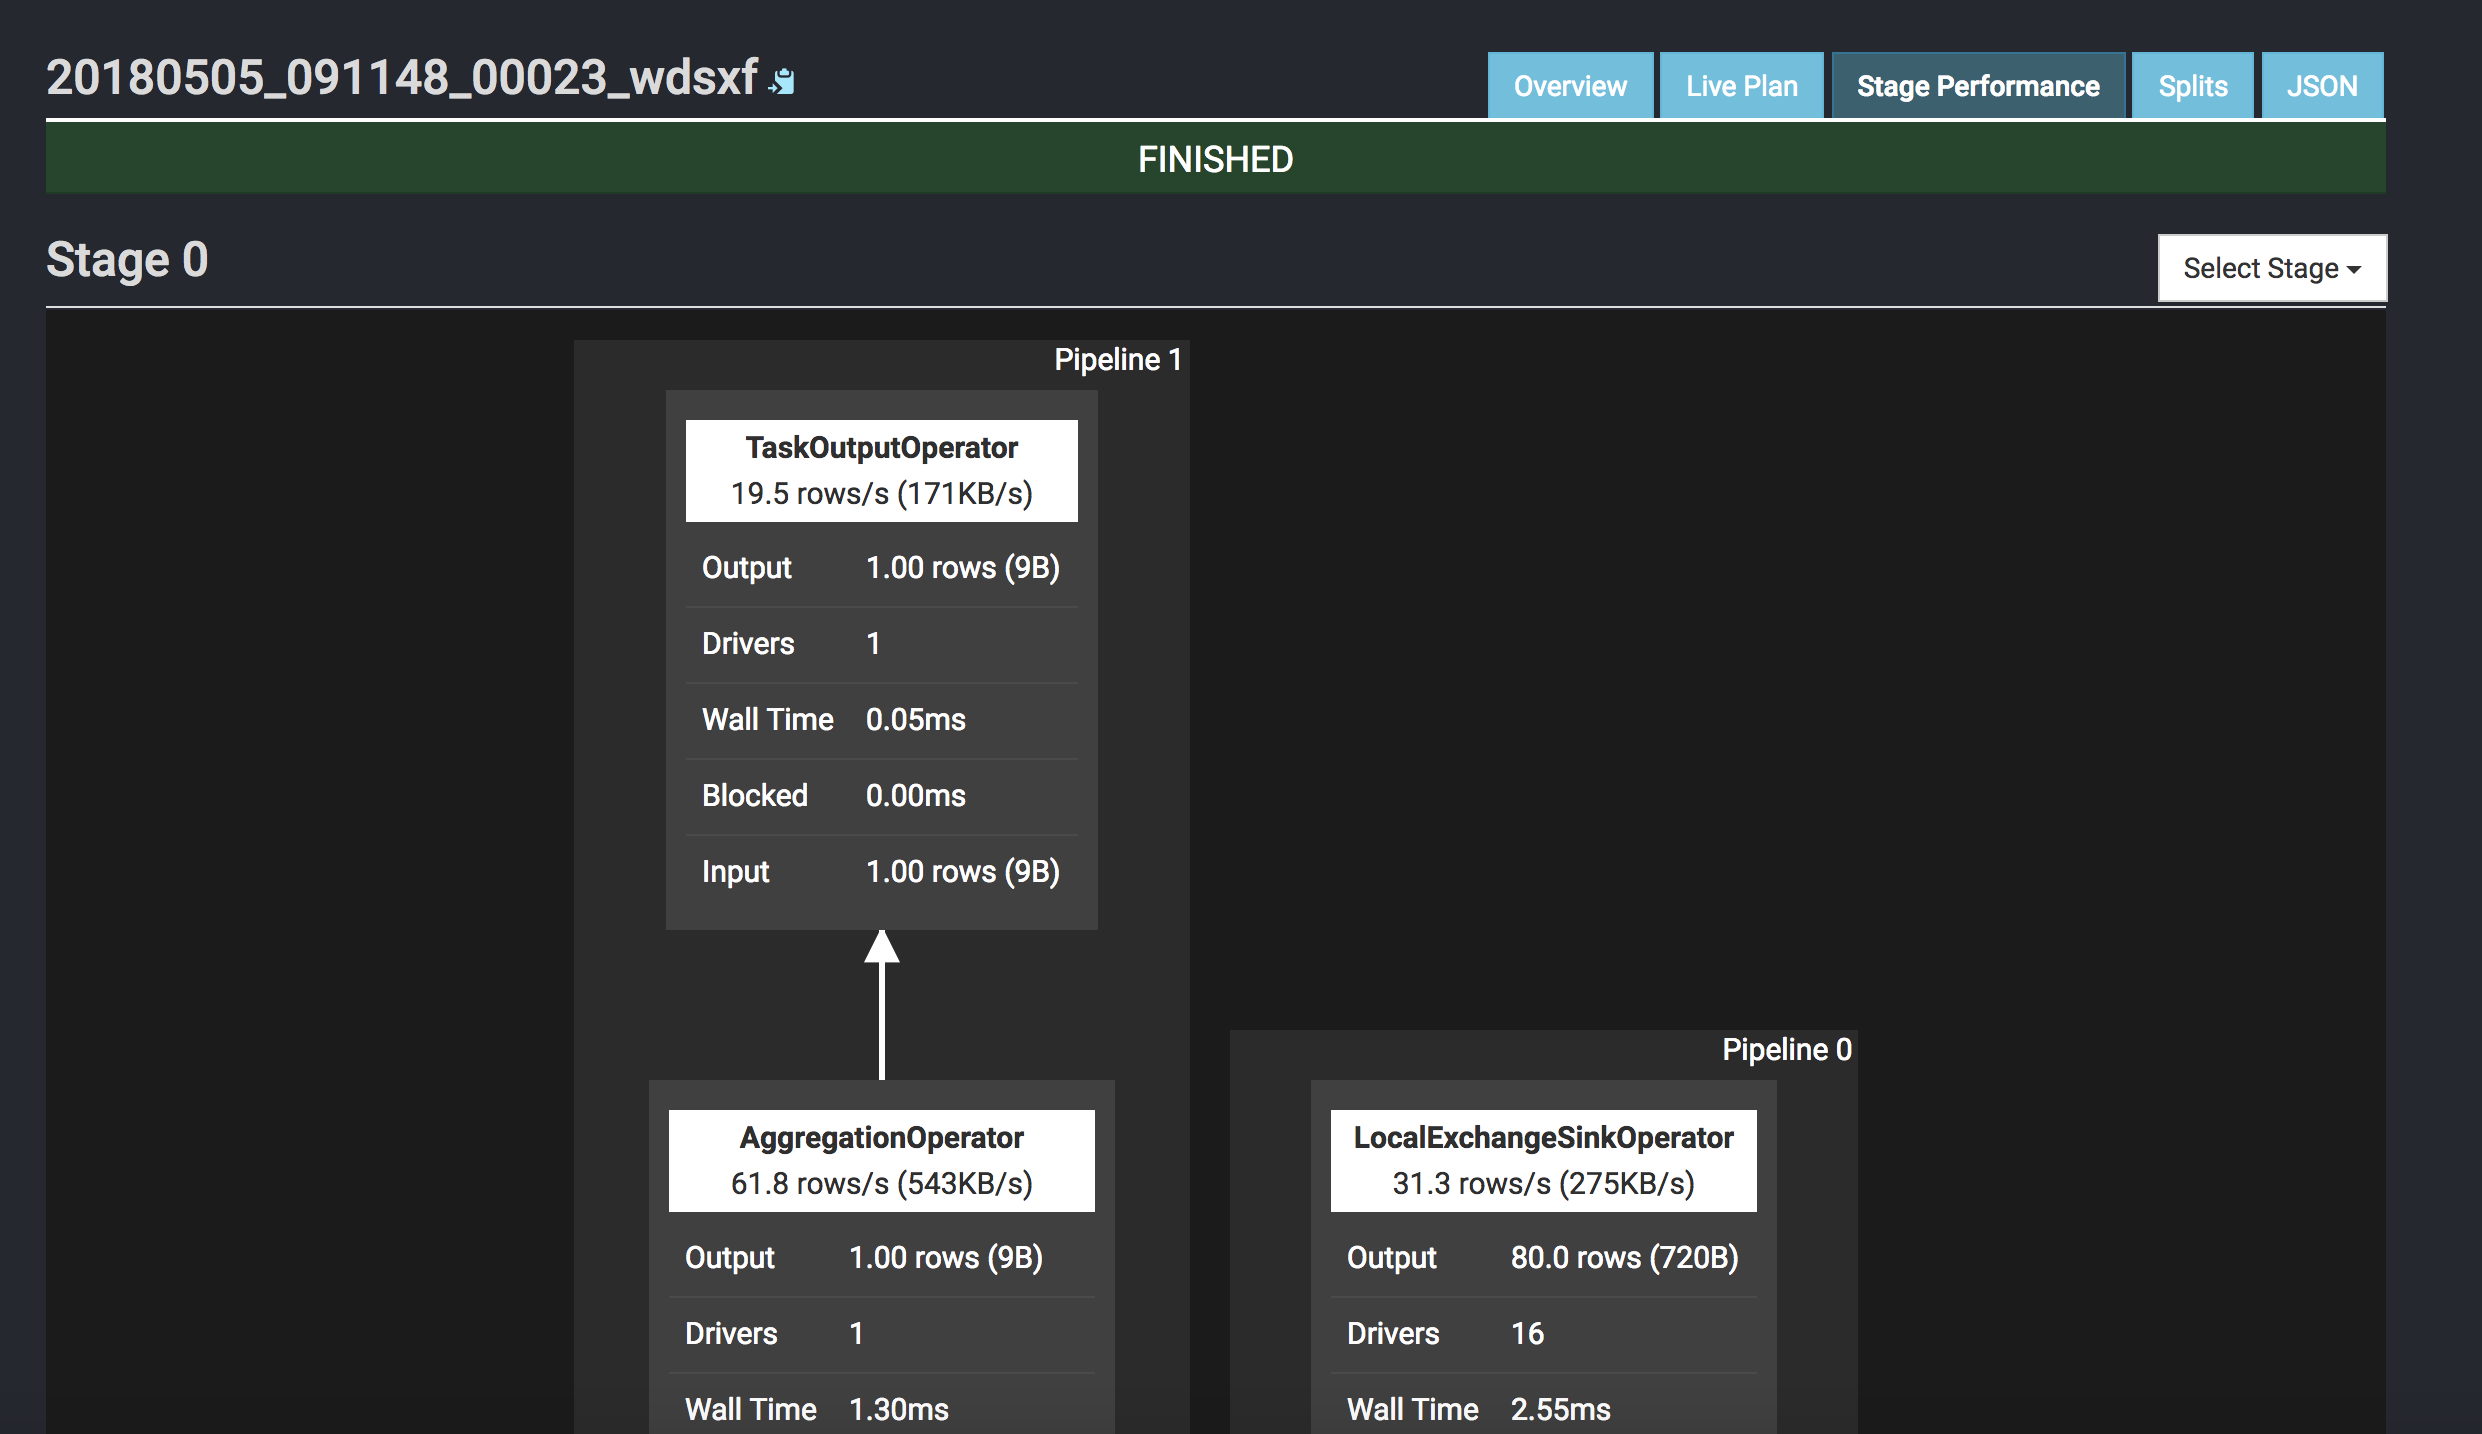
I did a simple query comparison between Tez and Presto, if you wanna accurate benchmark result, I think this benchmark test could help. The query is to calculate sum on a hive table.
Presto: 4s
presto:test> select sum(count) as sum from (
          -> select count(*) as count from t0004998 where month = '6.5'
          -> union
          -> select count(*) as count from t0004998 where typestatus in ('VL2216','VL2217','VL2218','VL2219','VL2220')
          -> union
          -> select count(*) as count from t0004998 where countrycode in ('FAMILY','FORM','GENUS','KINGDOM','ORDER','PHYLUM','SPECIES')
          -> ) t;
  sum
--------
 307374
(1 row)

Query 20180317_102034_00040_sq83e, FINISHED, 1 node
Splits: 29 total, 29 done (100.00%)
0:04 [982K rows, 374MB] [231K rows/s, 87.8MB/s]
Tez: 29.77s
hive> select sum(count) from (
    > select count(*) as count from t0004998 where month = "6.5"
    > union
    > select count(*) as count from t0004998 where typestatus in ("VL2216","VL2217","VL2218","VL2219","VL2220")
    > union
    > select count(*) as count from t0004998 where countrycode in ("FAMILY","FORM","GENUS","KINGDOM","ORDER","PHYLUM","SPECIES")
    > ) t;
Query ID = hdfs_20180317102109_5fd30986-f840-450e-aedd-b51c5e3a48f1
Total jobs = 1
Launching Job 1 out of 1
Status: Running (Executing on YARN cluster with App id application_1521267007048_0012)

--------------------------------------------------------------------------------
        VERTICES      STATUS  TOTAL  COMPLETED  RUNNING  PENDING  FAILED  KILLED
--------------------------------------------------------------------------------
Map 1 ..........   SUCCEEDED      1          1        0        0       0       0
Map 10 .........   SUCCEEDED      1          1        0        0       1       0
Map 8 ..........   SUCCEEDED      1          1        0        0       0       0
Reducer 11 .....   SUCCEEDED      1          1        0        0       0       0
Reducer 2 ......   SUCCEEDED      1          1        0        0       0       1
Reducer 4 ......   SUCCEEDED      1          1        0        0       0       0
Reducer 6 ......   SUCCEEDED      1          1        0        0       0       0
Reducer 7 ......   SUCCEEDED      1          1        0        0       0       0
Reducer 9 ......   SUCCEEDED      1          1        0        0       0       0
--------------------------------------------------------------------------------
VERTICES: 09/09  [==========================>>] 100%  ELAPSED TIME: 29.77 s
--------------------------------------------------------------------------------
OK
307374
Time taken: 30.732 seconds, Fetched: 1 row(s)
Presto is a distributed query engine which is developed by Facebook, for specific concept and advantages, please refer to the official document, below are the steps how I build pseudo cluster on my mac.
1.download presto
wget https://repo1.maven.org/maven2/com/facebook/presto/presto-server/0.196/presto-server-0.196.tar.gz
tar -zvxf presto-server-0.196.tar.gz && cd presto-server-0.196
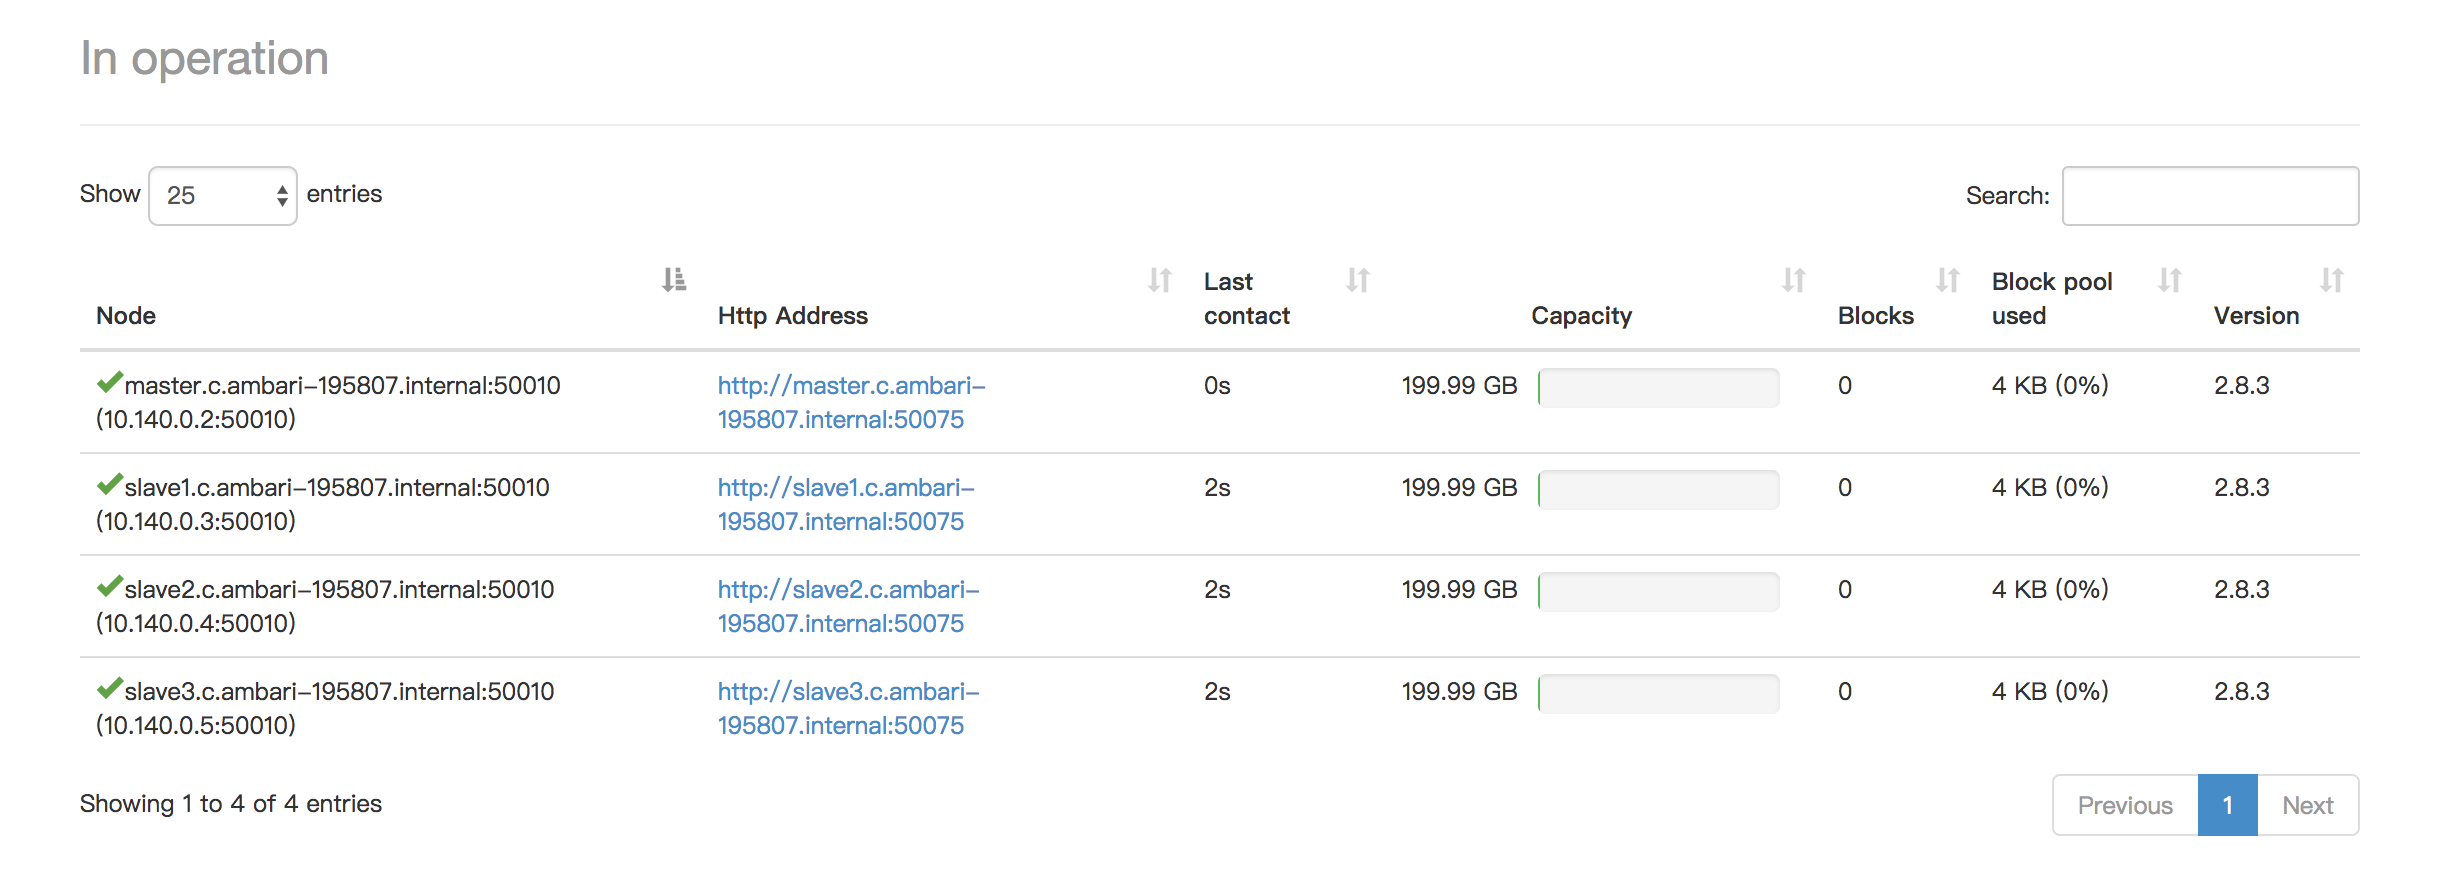
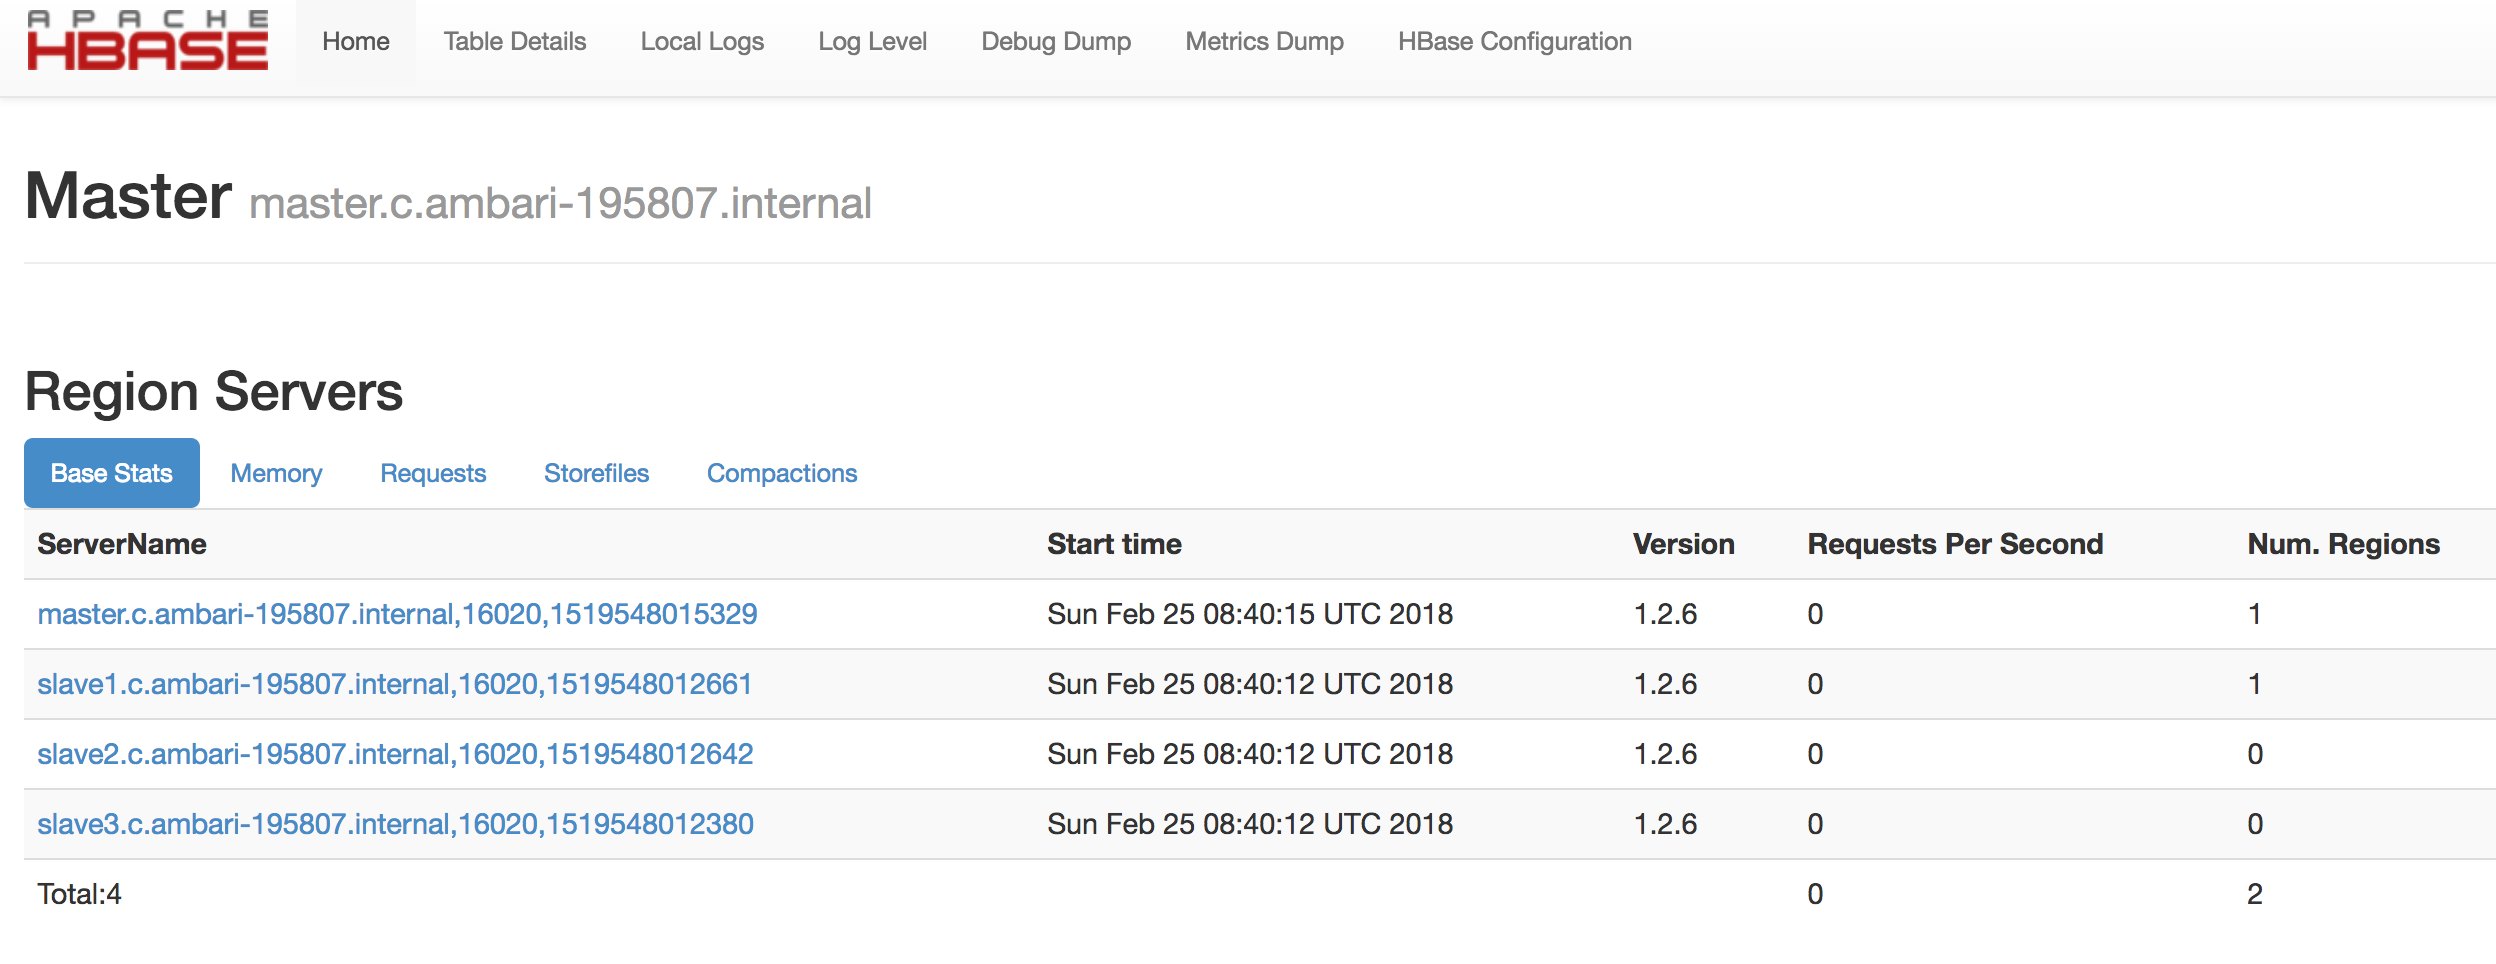
I test the performance of MR vs Tez again on cluster, I created a new table which contains 28,872,974 rows, below are cluster servers:
Host
OS
Memory
CPU
Disk
Region
master.c.ambari-195807.internal
CentOS 7
13 GB
Intel Ivy Bridge: 2
200G
asia-east1-a
slave1.c.ambari-195807.internal
CentOS 7
13 GB
Intel Ivy Bridge: 2
200G
asia-east1-a
slave2.c.ambari-195807.internal
CentOS 7
13 GB
Intel Ivy Bridge: 2
200G
asia-east1-a
slave3.c.ambari-195807.internal
CentOS 7
13 GB
Intel Ivy Bridge: 2
200G
asia-east1-a
1.MR
1.1.create table
hive> CREATE TABLE gbif.gbif_0004998
    > STORED AS ORC
    > TBLPROPERTIES("orc.compress"="snappy")
    > AS SELECT * FROM gbif.gbif_0004998_ori;
WARNING: Hive-on-MR is deprecated in Hive 2 and may not be available in the future versions. Consider using a different execution engine (i.e. spark, tez) or using Hive 1.X releases.
Query ID = gizmo_20180225064259_8df29800-b260-48f5-a409-80d6ea5200ad
Total jobs = 1
Launching Job 1 out of 1
Number of reduce tasks is set to 0 since there's no reduce operator
Starting Job = job_1519536795015_0001, Tracking URL = http://master.c.ambari-195807.internal:8088/proxy/application_1519536795015_0001/
Kill Command = /opt/apps/hadoop-2.8.3/bin/hadoop job  -kill job_1519536795015_0001
Hadoop job information for Stage-1: number of mappers: 43; number of reducers: 0
2018-02-25 06:43:15,110 Stage-1 map = 0%,  reduce = 0%
2018-02-25 06:44:15,419 Stage-1 map = 0%,  reduce = 0%, Cumulative CPU 231.6 sec
2018-02-25 06:44:36,386 Stage-1 map = 2%,  reduce = 0%, Cumulative CPU 380.45 sec
2018-02-25 06:44:37,810 Stage-1 map = 3%,  reduce = 0%, Cumulative CPU 386.09 sec
2018-02-25 06:44:41,695 Stage-1 map = 5%,  reduce = 0%, Cumulative CPU 422.02 sec
...
...
2018-02-25 06:47:36,112 Stage-1 map = 97%,  reduce = 0%, Cumulative CPU 1388.9 sec
2018-02-25 06:47:38,185 Stage-1 map = 98%,  reduce = 0%, Cumulative CPU 1392.1 sec
2018-02-25 06:47:45,434 Stage-1 map = 100%,  reduce = 0%, Cumulative CPU 1402.14 sec
MapReduce Total cumulative CPU time: 23 minutes 22 seconds 140 msec
Ended Job = job_1519536795015_0001
Stage-4 is selected by condition resolver.
Stage-3 is filtered out by condition resolver.
Stage-5 is filtered out by condition resolver.
Moving data to directory hdfs://master.c.ambari-195807.internal:9000/user/hive/warehouse/gbif.db/.hive-staging_hive_2018-02-25_06-42-59_672_2925216554228494176-1/-ext-10002
Moving data to directory hdfs://master.c.ambari-195807.internal:9000/user/hive/warehouse/gbif.db/gbif_0004998
MapReduce Jobs Launched:
Stage-Stage-1: Map: 43   Cumulative CPU: 1402.14 sec   HDFS Read: 11519083564 HDFS Write: 1210708016 SUCCESS
Total MapReduce CPU Time Spent: 23 minutes 22 seconds 140 msec
OK
Time taken: 288.681 seconds
1.2.query by on condition
hive> select count(*) as total from gbif_0004998 where mediatype = 'STILLIMAGE';
WARNING: Hive-on-MR is deprecated in Hive 2 and may not be available in the future versions. Consider using a different execution engine (i.e. spark, tez) or using Hive 1.X releases.
Query ID = gizmo_20180225065438_d2343424-5178-4c44-8b9d-0b28f8b701fa
Total jobs = 1
Launching Job 1 out of 1
Number of reduce tasks determined at compile time: 1
In order to change the average load for a reducer (in bytes):
  set hive.exec.reducers.bytes.per.reducer=<number>
In order to limit the maximum number of reducers:
  set hive.exec.reducers.max=<number>
In order to set a constant number of reducers:
  set mapreduce.job.reduces=<number>
Starting Job = job_1519536795015_0002, Tracking URL = http://master.c.ambari-195807.internal:8088/proxy/application_1519536795015_0002/
Kill Command = /opt/apps/hadoop-2.8.3/bin/hadoop job  -kill job_1519536795015_0002
Hadoop job information for Stage-1: number of mappers: 5; number of reducers: 1
2018-02-25 06:54:50,078 Stage-1 map = 0%,  reduce = 0%
2018-02-25 06:55:02,485 Stage-1 map = 40%,  reduce = 0%, Cumulative CPU 21.01 sec
2018-02-25 06:55:03,544 Stage-1 map = 80%,  reduce = 0%, Cumulative CPU 38.51 sec
2018-02-25 06:55:06,704 Stage-1 map = 100%,  reduce = 0%, Cumulative CPU 49.23 sec
2018-02-25 06:55:09,881 Stage-1 map = 100%,  reduce = 100%, Cumulative CPU 51.88 sec
MapReduce Total cumulative CPU time: 51 seconds 880 msec
Ended Job = job_1519536795015_0002
MapReduce Jobs Launched:
Stage-Stage-1: Map: 5  Reduce: 1   Cumulative CPU: 51.88 sec   HDFS Read: 1936305 HDFS Write: 107 SUCCESS
Total MapReduce CPU Time Spent: 51 seconds 880 msec
OK
2547716
Time taken: 32.292 seconds, Fetched: 1 row(s)
1.3.query by two conditions
hive> select count(*) as total from gbif_0004998 where mediatype = 'STILLIMAGE' and year > 1900;
WARNING: Hive-on-MR is deprecated in Hive 2 and may not be available in the future versions. Consider using a different execution engine (i.e. spark, tez) or using Hive 1.X releases.
Query ID = gizmo_20180225081238_766d3707-7eb4-4818-860e-887c48d507ce
Total jobs = 1
Launching Job 1 out of 1
Number of reduce tasks determined at compile time: 1
In order to change the average load for a reducer (in bytes):
  set hive.exec.reducers.bytes.per.reducer=<number>
In order to limit the maximum number of reducers:
  set hive.exec.reducers.max=<number>
In order to set a constant number of reducers:
  set mapreduce.job.reduces=<number>
Starting Job = job_1519545228015_0002, Tracking URL = http://master.c.ambari-195807.internal:8088/proxy/application_1519545228015_0002/
Kill Command = /opt/apps/hadoop-2.8.3/bin/hadoop job  -kill job_1519545228015_0002
Hadoop job information for Stage-1: number of mappers: 5; number of reducers: 1
2018-02-25 08:17:31,666 Stage-1 map = 0%,  reduce = 0%
2018-02-25 08:17:43,866 Stage-1 map = 20%,  reduce = 0%, Cumulative CPU 10.58 sec
2018-02-25 08:17:46,045 Stage-1 map = 60%,  reduce = 0%, Cumulative CPU 34.12 sec
2018-02-25 08:17:54,996 Stage-1 map = 80%,  reduce = 0%, Cumulative CPU 41.73 sec
2018-02-25 08:17:57,126 Stage-1 map = 100%,  reduce = 0%, Cumulative CPU 51.37 sec
2018-02-25 08:17:58,192 Stage-1 map = 100%,  reduce = 100%, Cumulative CPU 53.72 sec
MapReduce Total cumulative CPU time: 53 seconds 720 msec
Ended Job = job_1519545228015_0002
MapReduce Jobs Launched:
Stage-Stage-1: Map: 5  Reduce: 1   Cumulative CPU: 53.72 sec   HDFS Read: 8334197 HDFS Write: 107 SUCCESS
Total MapReduce CPU Time Spent: 53 seconds 720 msec
OK
2547716
Time taken: 321.138 seconds, Fetched: 1 row(s)
2.Tez
2.1.create table
hive> CREATE TABLE gbif.gbif_0004998
    > STORED AS ORC
    > TBLPROPERTIES("orc.compress"="snappy")
    > AS SELECT * FROM gbif.gbif_0004998_ori;
Query ID = gizmo_20180225075657_bae527a7-7cbd-46d9-afbf-70a5adcdee7c
Total jobs = 1
Launching Job 1 out of 1
Status: Running (Executing on YARN cluster with App id application_1519545228015_0001)

----------------------------------------------------------------------------------------------
        VERTICES      MODE        STATUS  TOTAL  COMPLETED  RUNNING  PENDING  FAILED  KILLED
----------------------------------------------------------------------------------------------
Map 1 .......... container     SUCCEEDED      1          1        0        0       0       0
----------------------------------------------------------------------------------------------
VERTICES: 01/01  [==========================>>] 100%  ELAPSED TIME: 639.61 s
----------------------------------------------------------------------------------------------
Moving data to directory hdfs://master.c.ambari-195807.internal:9000/user/hive/warehouse/gbif.db/gbif_0004998
OK
Time taken: 664.817 seconds
2.2.query by one condition
hive> select count(*) as total from gbif_0004998 where mediatype = 'STILLIMAGE';
Query ID = gizmo_20180225080856_d1f13489-30b0-4045-bdeb-e3e5e085e736
Total jobs = 1
Launching Job 1 out of 1
Status: Running (Executing on YARN cluster with App id application_1519545228015_0001)

----------------------------------------------------------------------------------------------
        VERTICES      MODE        STATUS  TOTAL  COMPLETED  RUNNING  PENDING  FAILED  KILLED
----------------------------------------------------------------------------------------------
Map 1 .......... container     SUCCEEDED      5          5        0        0       0       0
Reducer 2 ...... container     SUCCEEDED      1          1        0        0       0       0
----------------------------------------------------------------------------------------------
VERTICES: 02/02  [==========================>>] 100%  ELAPSED TIME: 17.91 s
----------------------------------------------------------------------------------------------
OK
2547716
Time taken: 19.255 seconds, Fetched: 1 row(s)
2.2.query by two conditions
hive> select count(*) as total from gbif_0004998 where mediatype = 'STILLIMAGE' and year > 1900;
Query ID = gizmo_20180225081200_0279f8e6-544b-4573-858b-33f48bf1fa35
Total jobs = 1
Launching Job 1 out of 1
Status: Running (Executing on YARN cluster with App id application_1519545228015_0001)

----------------------------------------------------------------------------------------------
        VERTICES      MODE        STATUS  TOTAL  COMPLETED  RUNNING  PENDING  FAILED  KILLED
----------------------------------------------------------------------------------------------
Map 1 .......... container     SUCCEEDED      5          5        0        0       0       0
Reducer 2 ...... container     SUCCEEDED      1          1        0        0       0       0
----------------------------------------------------------------------------------------------
VERTICES: 02/02  [==========================>>] 100%  ELAPSED TIME: 16.96 s
----------------------------------------------------------------------------------------------
OK
2547716
Time taken: 17.635 seconds, Fetched: 1 row(s)
3.Summary
Rows: 28,872,974
Type
Create Table
Query By One Condition
Query By Two Conditions
MR
288.681s
32.292s
321.138s
Tez
664.817s
19.255s
17.635s
According to the result, MR is quicker than Tez on creation, but slower than Tez on query, along with query condition’s increase, MR’s query performance became worse.
But why MR is quicker than Tez on creation, currently I don’t know, need to be investigated later.
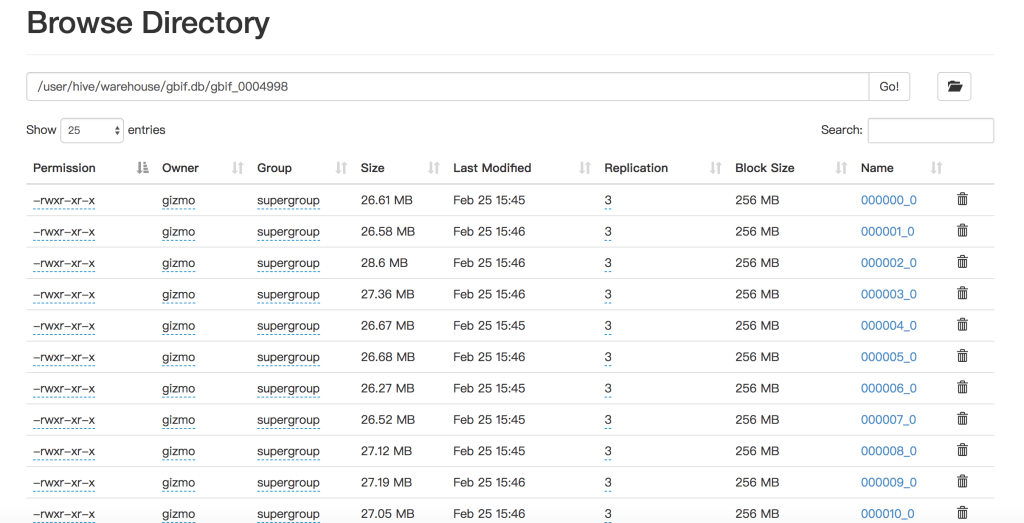
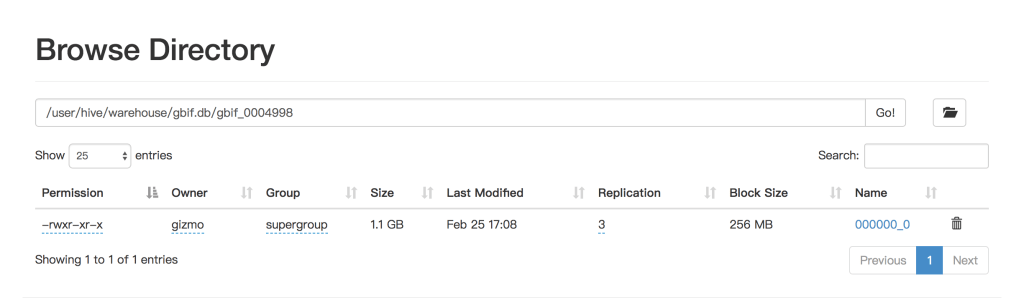
Maybe it has relationship with storage, I have checked the filesystem after the two kinds of creation, it’s different. MR has many small files, but Tez has one much bigger file.


Reply